Olive Oil Prices: Week 35 of 2026
Turkish exchange prices, European producer prices and exchange rates side by side: extra virgin at 300 TL/kg in Edremit, Spain's national average €3.52/kg.

This bulletin brings together three open sources: trades registered at Turkish commodity exchanges (TOBB), weekly producer prices in Europe (European Commission) and exchange rates (European Central Bank). Figures were compiled on 25 August 2026.
Turkey: registered exchange prices
| Product | Exchange | Average TL/kg | Trade date |
|---|---|---|---|
| Extra virgin olive oil | Aydın | 307.60 | 18.08.2026 |
| Extra virgin olive oil | Edremit | 300.00 | 24.08.2026 |
| Extra virgin olive oil | Nazilli | 201.09 | 19.08.2026 |
| Crude olive oil | Gaziantep | 250.00 | 06.08.2026 |
| Crude olive oil | Nazilli | 230.00 | 21.08.2026 |
| Crude olive oil | Aydın | 187.40 | 21.07.2026 |
| Crude olive oil | Edremit | 158.40 | 30.07.2026 |
| Olive oil (cooking) | Edremit | 225.00 | 19.08.2026 |
| Green olives, special | Edremit | 165.00 | 24.08.2026 |
| Black olives, brined | Edremit | 95.00 | 17.07.2026 |
| Olives for oil | Edremit | 38.00 | 26.06.2026 |
⚠ These are not daily quotations but prices registered on the day that product actually traded. Dates differ because the olive is seasonal.
Europe: weekly producer prices (extra virgin)
| Country / market | €/kg | Weekly change | Week ending |
|---|---|---|---|
| Spain (national average) | 3.52 | ▼ 1.2% | 16.08.2026 |
| Jaén | 3.45 | ▼ 1.6% | 16.08.2026 |
| Italy (national average) | 4.88 | ▼ 1.0% | 02.08.2026 |
| Bari | 4.55 | → 0.0% | 02.08.2026 |
Exchange rates (24.08.2026)
- 1 EUR = 56.0821 TRY
- 1 EUR = 1.1664 USD
- 1 USD = 48.0814 TRY (cross rate)
What this week's tables show
Three of the four European prices fell. Spain's national average was down 1.2%, Jaén 1.6%, Italy 1.0%; Bari was flat. The single-week moves are small, but the direction is shared. For context: the International Olive Council recorded 2024/25 as a record 3.57 million tonnes — a continuation of the normalisation from the historic highs of the 2022-2023 drought.
In euro terms the gap between Turkey and Europe is wide. At 300 TL/kg in Edremit, extra virgin works out at €5.35/kg at 56.0821. Spain's national average the same week was €3.52. The Turkish registered price is therefore roughly 52% above Spain's and about 10% above Italy's (€4.88).
⚠ Read that comparison carefully: the European figure is a weekly average producer price, the Turkish one the price of individual registered trades. They do not measure the same thing. Even so, the gap shows that olive oil is not cheap in euro terms on the Turkish domestic market.
The spread between exchanges is striking. The same product — extra virgin — stood at 307.60 TL in Aydın, 300.00 in Edremit and 201.09 in Nazilli. Nazilli's average is about a third below the others, with a low of 132.79 TL, and its traded volume of 64,720 kg dwarfs the rest. Large bulk sales pulling the average down is the readable explanation. There is no single "Turkish price"; which exchange, and at what volume, decides it.
The distance between raw material and finished product. Olives for oil traded at 38.00 TL/kg in Edremit (26 June). Given that roughly five to six kilos of olives yield one kilo of oil, the raw material cost lands somewhere in the 190-230 TL per kilo band. With extra virgin at 300.00 TL on the same exchange, the remainder covers milling, storage, financing and margin. ⚠ The two dates are two months apart — this is an order of magnitude, not a costing.
The step between crude and extra virgin is equally visible. In Edremit crude oil stood at 158.40 TL against 300.00 for extra virgin, with cooking-grade at 225.00 — a direct reading of how the difference between grades shows up in price.
Sources and method
Turkish figures come from the TOBB commodity exchange price system, European figures from the European Commission Agri-food Data Portal open API, and exchange rates from the European Central Bank daily reference rates. Continuously updated tables live on the market page.
This bulletin is not investment advice; it is a compilation and comparison of publicly available data.
One rating per visitor; you can change yours at any time. Ratings are real reader votes — no seeded or default scores.
Related
 Article
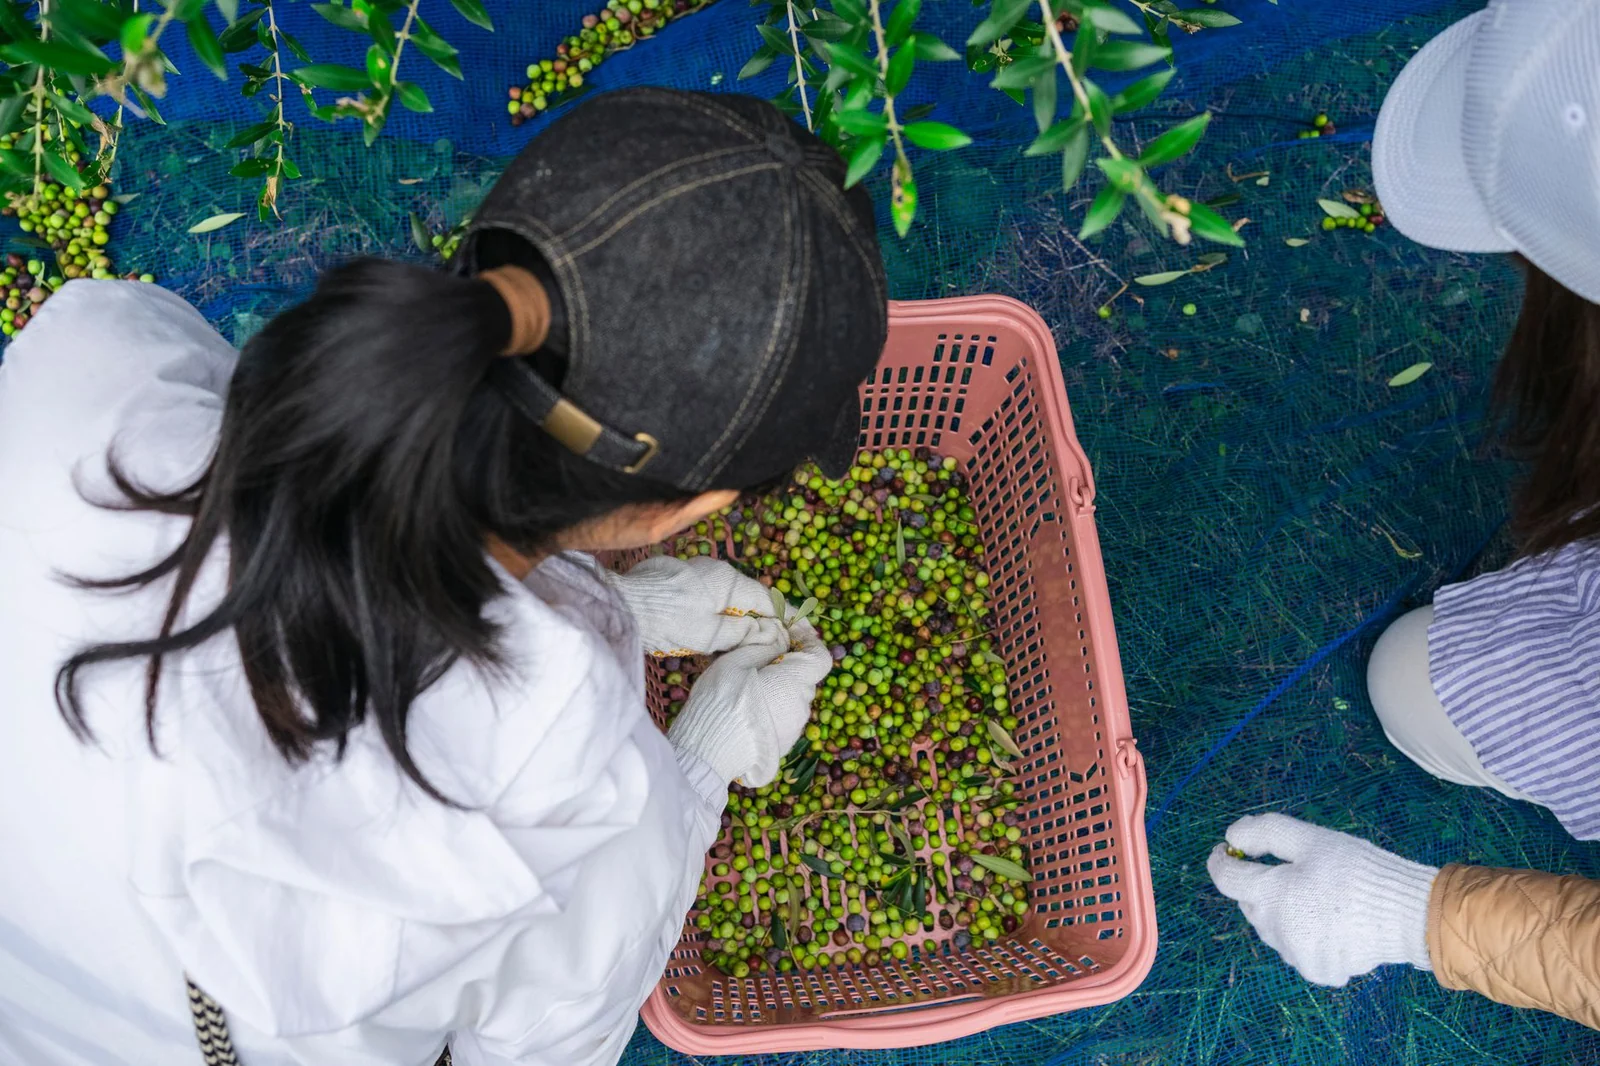
Structural problems of Turkish olive growing
157 million trees but 5% of world output: low yield, old trees, harvest mechanisation, missing data, the support gap and informality.
Article
Structural problems of Turkish olive growing
157 million trees but 5% of world output: low yield, old trees, harvest mechanisation, missing data, the support gap and informality.
 Article
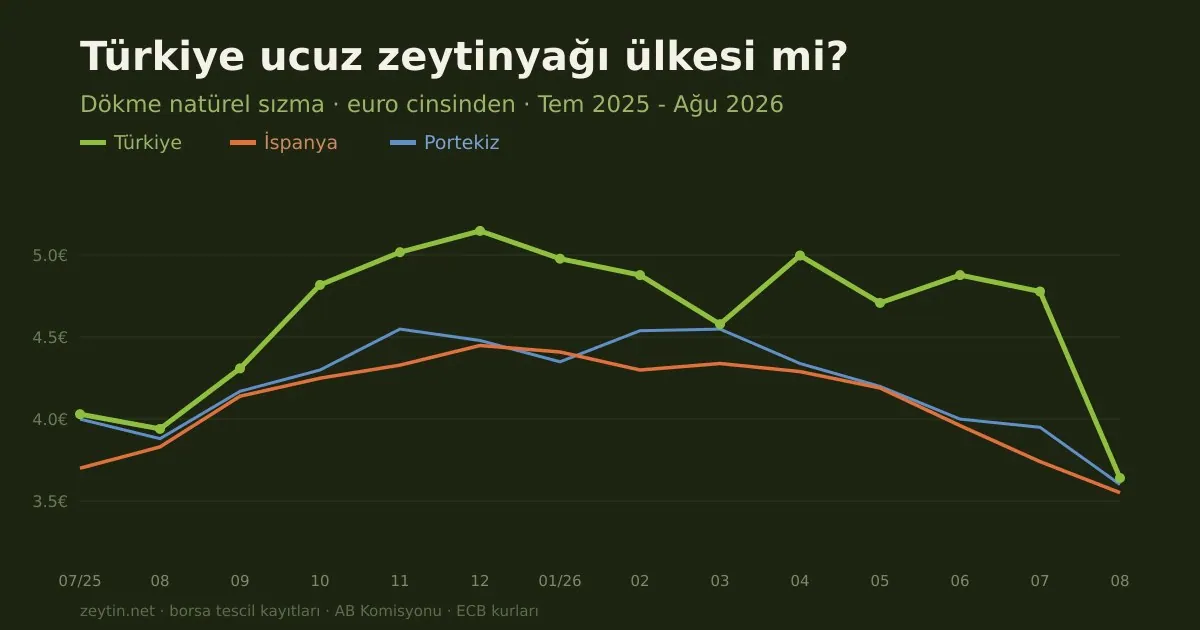
Is Turkish olive oil cheap? Fourteen months against Europe
Turkish and European olive oil prices compared in one currency. How wide is the gap, and is it currency or market?
Article
Is Turkish olive oil cheap? Fourteen months against Europe
Turkish and European olive oil prices compared in one currency. How wide is the gap, and is it currency or market?
 Article
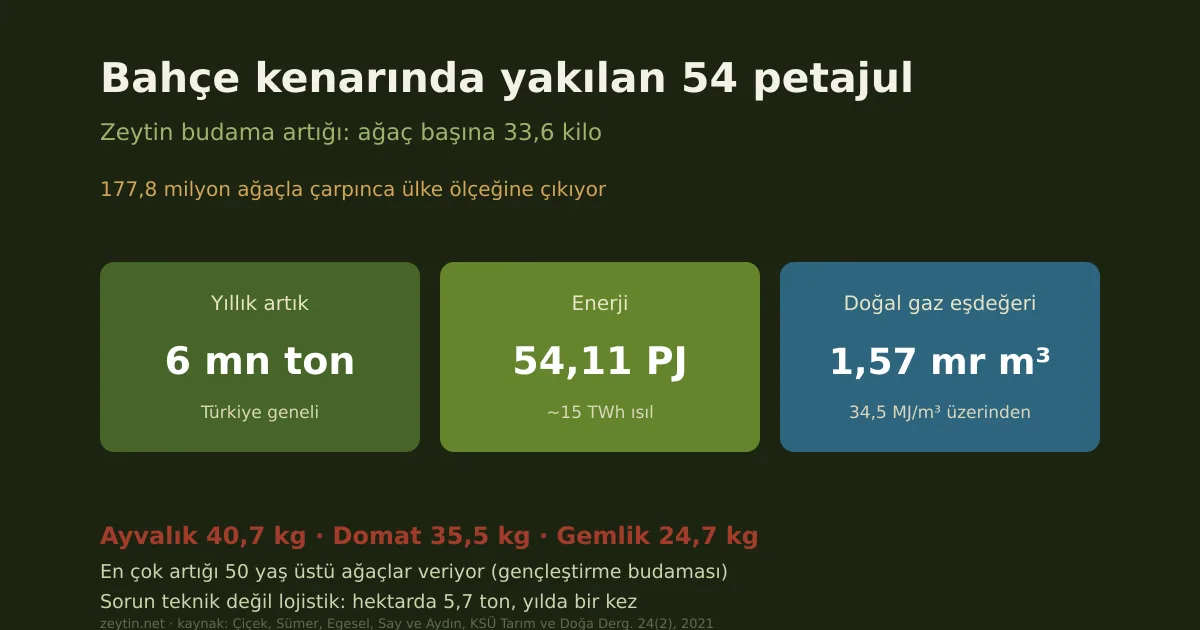
The energy burned at the field edge: olive pruning residue
One olive tree yields 33.6 kg of prunings a year. Across 177.8 million trees that is 6 million tonnes of residue and 54.11 PJ of energy — equivalent to 1.57 billion m³ of natural gas.
Article
The energy burned at the field edge: olive pruning residue
One olive tree yields 33.6 kg of prunings a year. Across 177.8 million trees that is 6 million tonnes of residue and 54.11 PJ of energy — equivalent to 1.57 billion m³ of natural gas.
 Article
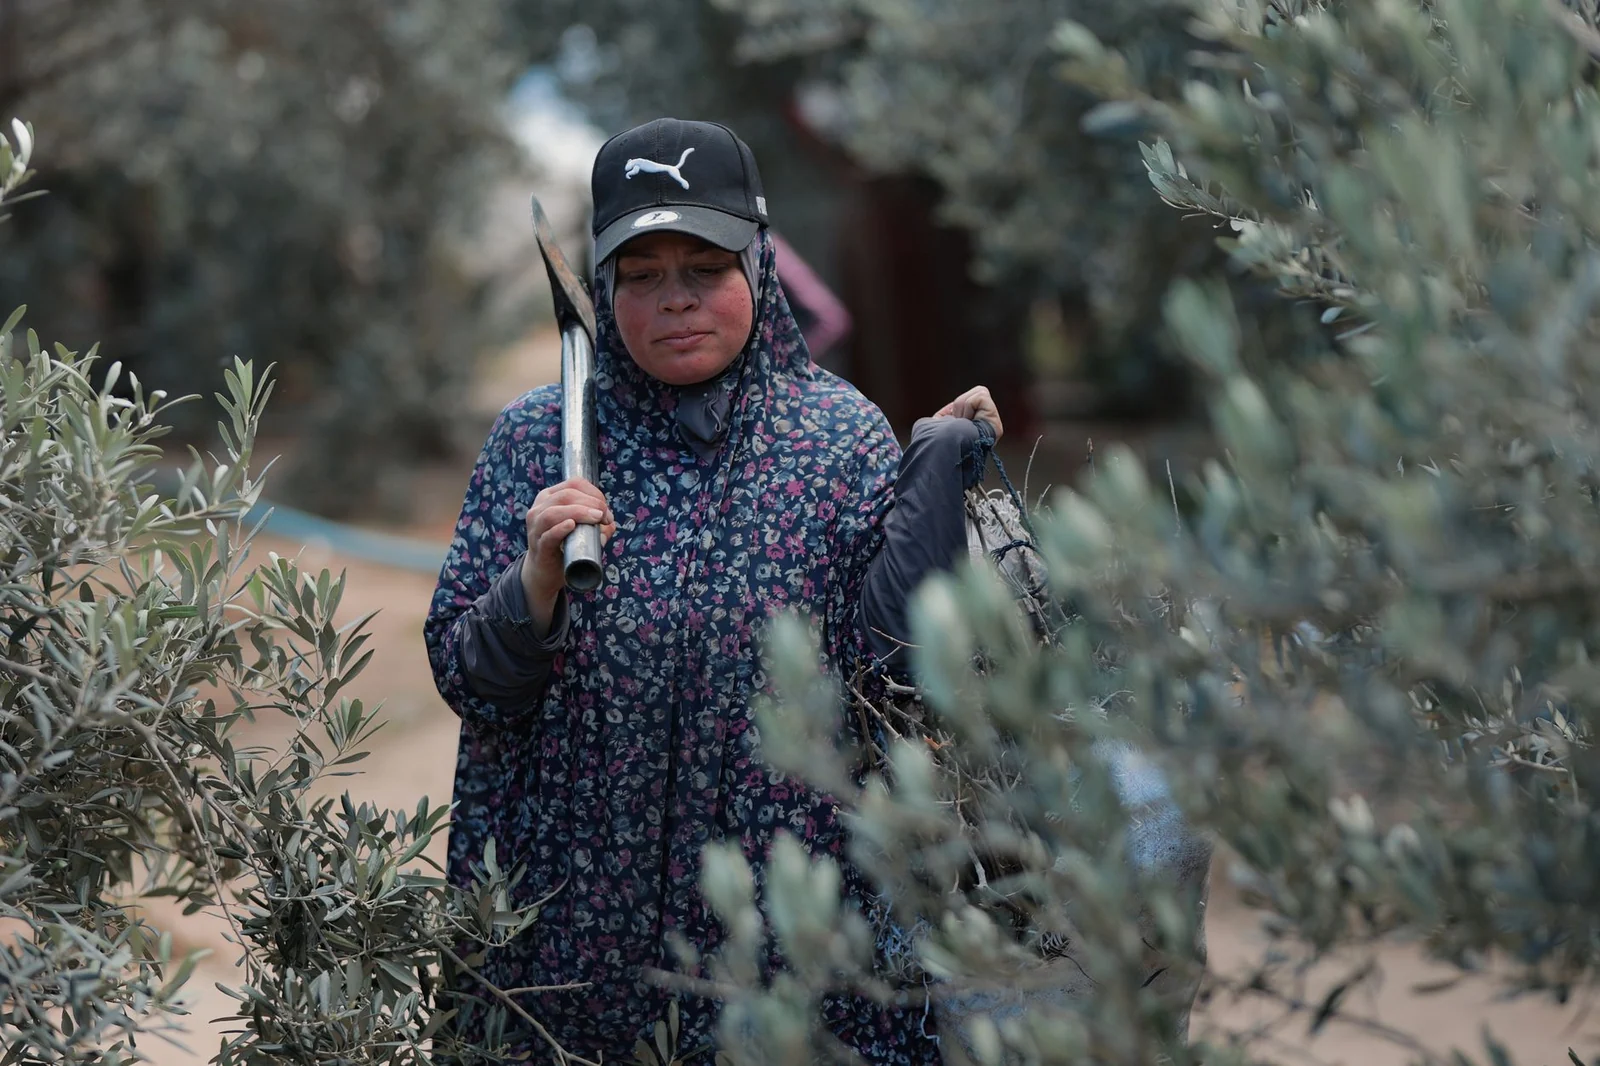
How do olive growers rank their own problems?
A face-to-face survey with 64 growers in İzmir: input costs, an average holding of 45 decares, unirrigated land, and cooperative membership that rises with scale.
Article
How do olive growers rank their own problems?
A face-to-face survey with 64 growers in İzmir: input costs, an average holding of 45 decares, unirrigated land, and cooperative membership that rises with scale.