When should olive leaf analysis be done? July or November-January: in the same trees nitrogen falls from 2.78 to 1.29 per cent
A 12-month series on Uslu olive leaves shows nitrogen at 2.78 per cent in July and 1.29 per cent in December; a study from the Olive Research Institute found November-January the most stable period. The article compares this with the California July recipe and explains why the interpretation table must match the sampling period.
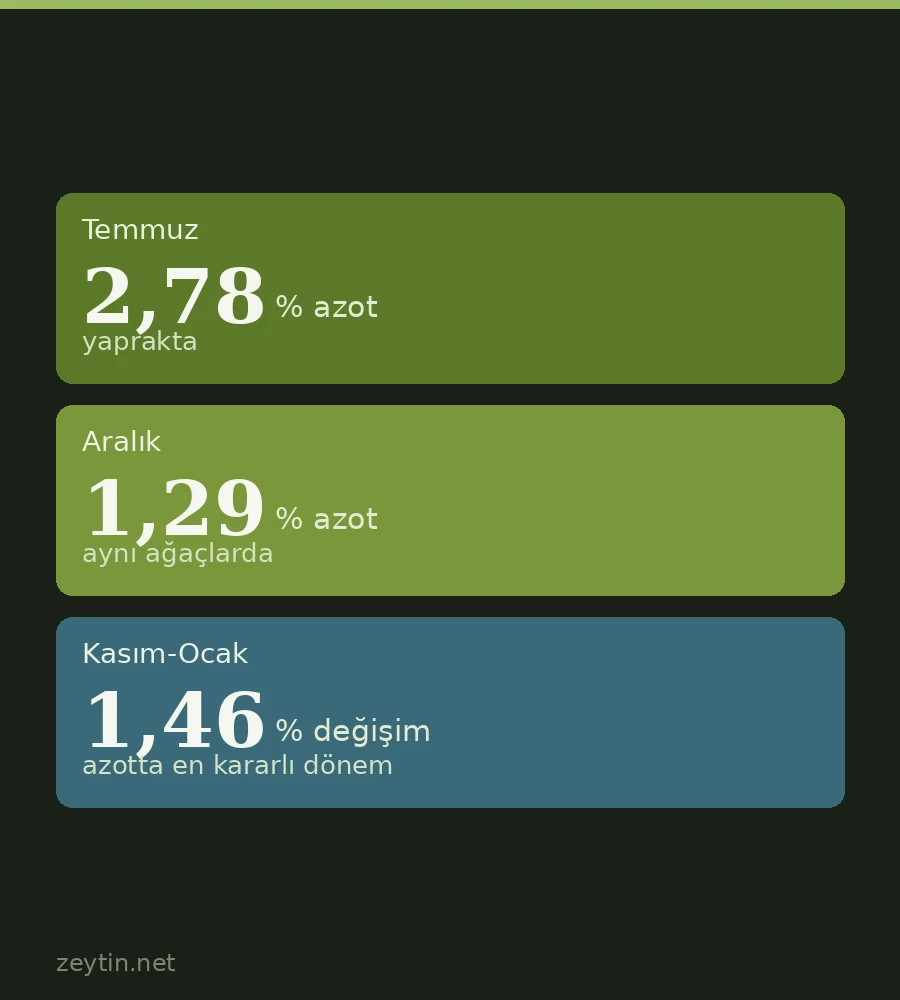
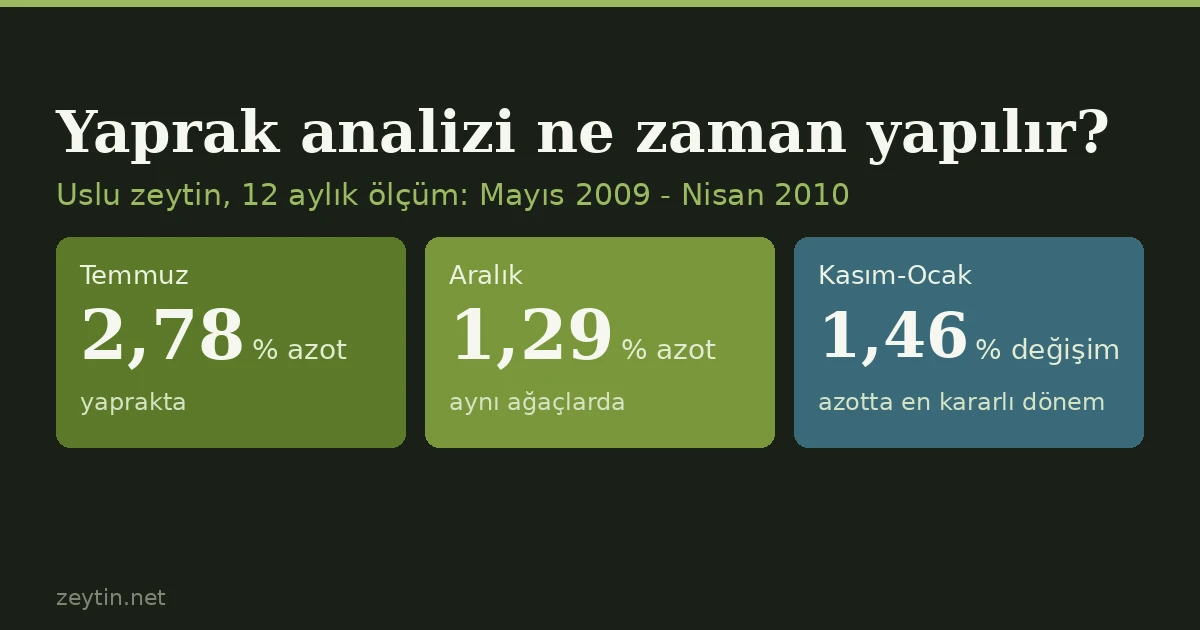
Short answer: The result of a leaf analysis can come out completely different depending on the month the sample is taken, so the table you use to interpret it has to belong to the same period as the sample. University of California material and a literature review recommend sampling in July; in Türkiye a study by the Olive Research Institute found that November-January is the most stable period in the Uslu variety. In the same trees, leaf nitrogen was 2.78 per cent in July and 1.29 per cent in December.
We explain the November-January sampling and the standard values in our nutrient deficiencies article. This article shows, with a 12-month series of measurements, why that table is tied to that period.
One tree, twelve months
The study by Aydoğdu, Turan, Pekcan and Torun, published in the Çukurova Journal of Agricultural and Food Sciences (2016, volume 31, issue 3), took leaves in the first week of each month between May 2009 and April 2010 from 40-year-old drip-irrigated Uslu trees planted at 5 x 7.5 metres at the Olive Research Institute's orchard in Bornova. Samples were collected from opposite leaf pairs in the middle of the annual tip shoots, from all four sides of the tree. There were three trees in each of four replicates; 2009 was an on year and 2010 an off year.
| Month | Nitrogen (N) | Phosphorus (P) | Potassium (K) | Calcium (Ca) | Magnesium (Mg) |
|---|---|---|---|---|---|
| May | 2.16 | 0.11 | 0.72 | 1.71 | 0.13 |
| June | 2.70 | 0.14 | 1.43 | 1.21 | 0.13 |
| July | 2.78 | 0.13 | 1.38 | 1.63 | 0.16 |
| August | 1.48 | 0.12 | 1.12 | 2.13 | 0.17 |
| September | 1.25 | 0.13 | 1.39 | 1.97 | 0.17 |
| October | 1.34 | 0.11 | 1.10 | 2.18 | 0.18 |
| November | 1.37 | 0.11 | 1.16 | 1.96 | 0.19 |
| December | 1.29 | 0.11 | 0.98 | 1.81 | 0.16 |
| January | 1.35 | 0.12 | 1.02 | 1.55 | 0.18 |
| February | 0.89 | 0.11 | 0.87 | 2.13 | 0.17 |
| March | 1.19 | 0.10 | 0.81 | 2.21 | 0.17 |
| April | 1.24 | 0.10 | 0.80 | 2.23 | 0.17 |
Nitrogen rises to 2.70-2.78 per cent in June-July, falls to 1.48 per cent in August and reaches its lowest at 0.89 per cent in February. The July value is about 2.2 times the December value; that ratio is our own calculation. The authors report that nitrogen rises from May to July (the flowering and fruit-formation period) and that phosphorus and potassium peak in June; they link the February nitrogen dip to the plant's rest period after harvest.
Which months are "stable"?
The researchers compared the per cent change of each element in June-October with that in November-January:
| Element | June-October | November-January |
|---|---|---|
| Nitrogen | 50.37 | 1.46 |
| Phosphorus | 21.43 | 9.10 |
| Potassium | 23.08 | 12.07 |
| Calcium | 80.2 | 20.9 |
| Magnesium | 38.5 | 5.3 |
In all five elements the November-January change is smaller. For this reason the authors proposed November-January as the leaf sampling period for this variety. The logic is that a sample taken when change is small gives a value that does not drift from month to month or week to week, whereas in June-July the same tree can give very different results within a few weeks.
The same study reports the November-January averages: nitrogen 1.34 per cent, phosphorus 0.11, potassium 1.05, calcium 1.77 and magnesium 0.18. The authors compared these with the limit values in the institute's 1993 survey report and placed nitrogen and magnesium in the "low" class, and phosphorus, potassium and calcium in the "adequate" class.
The July sample: the California recipe
A University of California Cooperative Extension presentation on olive nutrition describes leaf analysis as a way to assess nutrient status and build a fertiliser programme, and says the sample is made up in July of 100 mature leaves taken from the middle of non-fruiting shoots. The limit values in the same presentation are: nitrogen 1.4 per cent "deficient" and 1.5-2.0 per cent "optimum"; potassium 0.4 deficient and 0.8-1.0 optimum; boron 14 ppm deficient and 19-150 ppm optimum. A literature review also gives these values as Fernández-Escobar's interpretation for leaves sampled in July in the northern hemisphere. The same review notes that some authors consider July the right time and others consider the winter period adequate; in one boron study, July and January samples were compared and leaf boron was consistently higher in July than in January.
What happens if the two calendars are mixed?
Let us apply this to the Uslu trees in the table. In the July sample nitrogen is 2.78 per cent. If you read this value against a standard table prepared for November-January (on our site's table, above 2.5 per cent is "very high"), the tree looks over-fed with nitrogen; against the 2.0 per cent "optimum" upper limit of the July table it is also high. The same trees' December value is 1.29 per cent, which the study itself classes as "low". So the same trees, in the same year, move from "very high" to "low" as the month changes; the difference comes from the month, not from the tree. A table should therefore be used only with samples from the period it was prepared for. The data in this study only shows that; it does not rule on which table is right for which variety and region.
What to do in practice
- Ask the laboratory: find out which sampling-period table they will use to interpret the result.
- Use the same period every year. Comparison is meaningful only between samples of the same month.
- Follow the sampling recipe. The study in Türkiye takes opposite leaf pairs from the middle of annual shoots on all four sides of the tree, and the California presentation takes 100 mature leaves from the middle of non-fruiting shoots; what they share is the leaf from the middle of the shoot.
- Read leaf analysis together with soil analysis. Aydoğdu and colleagues also write that a fertiliser programme should rest on soil and leaf analysis taken together. For the soil side, see our fertilisation and soil analysis article.
Limits
This is one variety (Uslu), one plot and one 12-month period, and the on year was not separated from the off year. In another variety, region or year the monthly curve may look different. This article does not say definitively which period is "right"; it only shows how much the sampling time can change the result and that the interpretation table has to match the sampling period.
One rating per visitor; you can change yours at any time. Ratings are real reader votes — no seeded or default scores.
Related
 Article
Can olive prunings be burned? What the law says and what to do with diseased wood
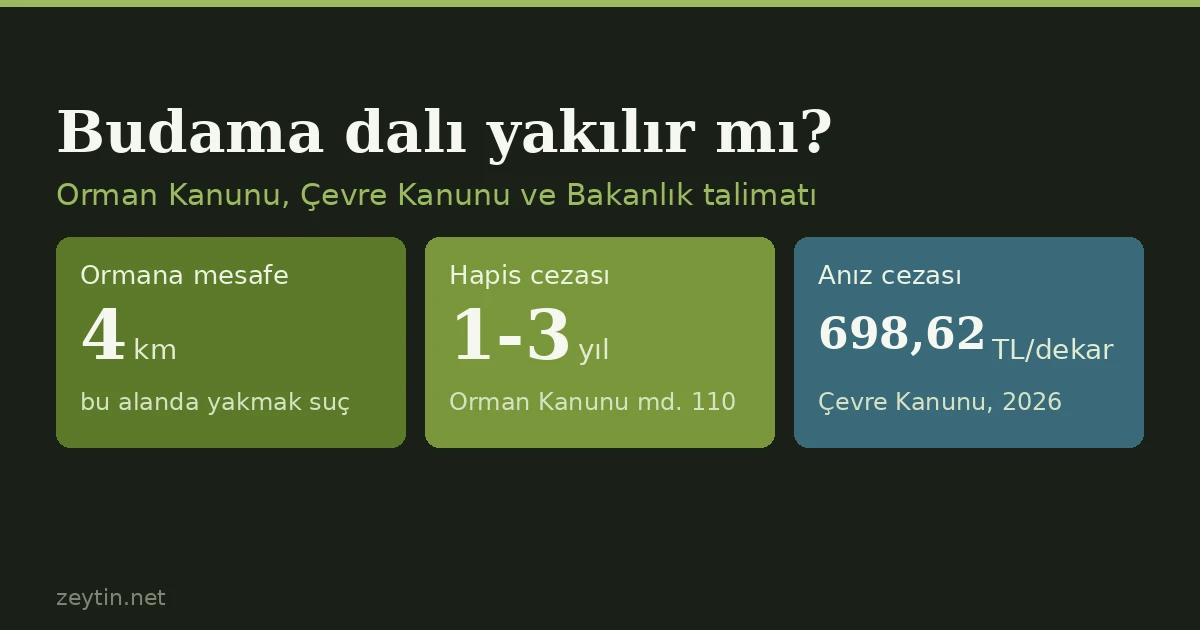
Burning prunings within four kilometres of a forest, or in a village with state forest inside its boundary, is an offence under Türkiye's Forest Law carrying one to three years in prison, and many governors' orders also ban burning to clear olive groves. The ministry's own technical guidance, however, recommends burning diseased residues. The way between: use healthy wood, remove diseased wood from the grove.
 Article
What happens if an olive tree goes without water? Signs of drought stress, what it costs at each stage and what to do in a dry year
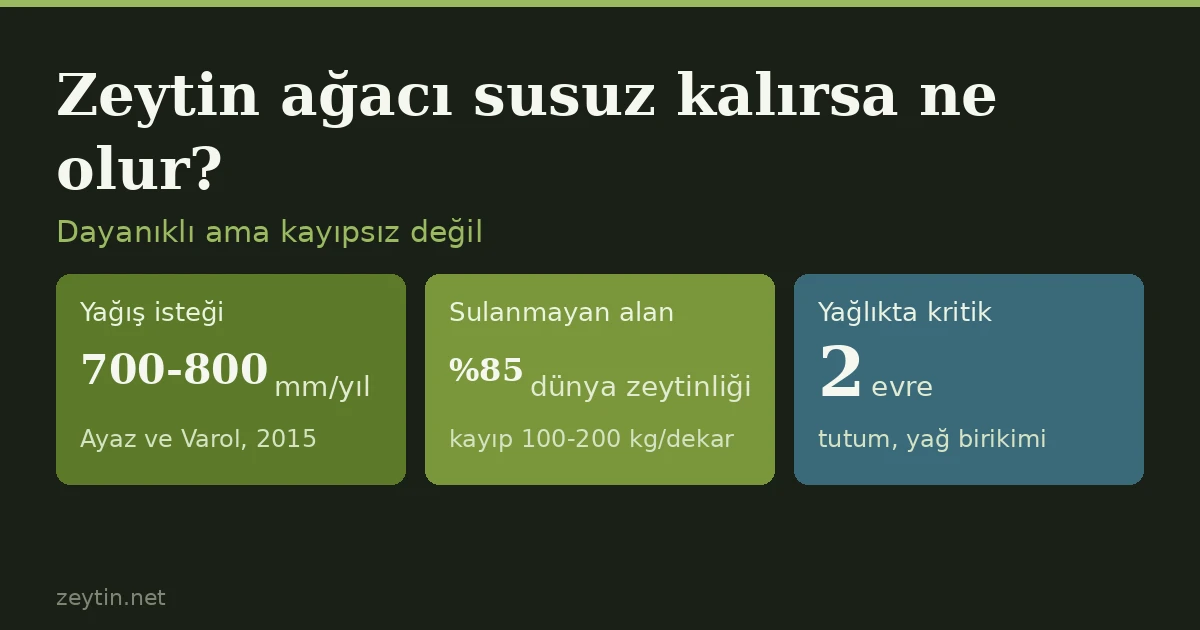
The olive copes with drought by halting canopy growth and narrowing its stomata, but pays in flower buds, fruit set, fruit size and oil content. Drawing on three sources, the article covers the effect of water stress by growth stage, rainfall needs and measures for a dry year, and states plainly that no reliable figure exists for how many days an olive can last without water.
 Article
What happens when snow falls on an olive tree? Broken branches, frost and what to do
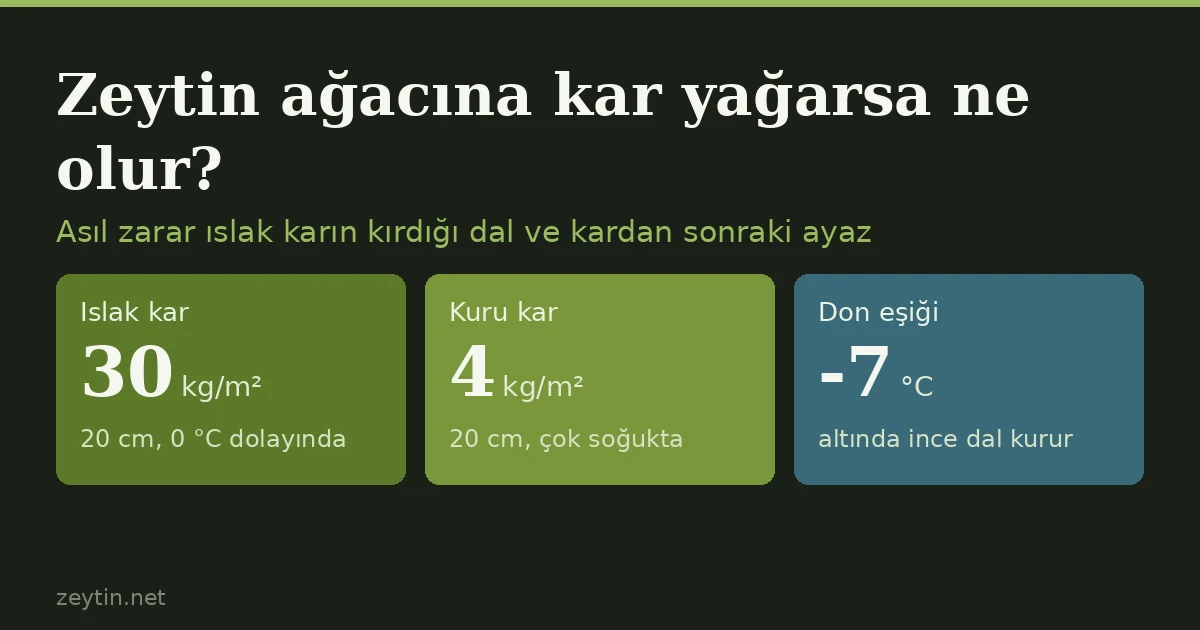
Snow is usually less dangerous to olives than cold itself; the damage comes from wet snow breaking branches and the frost that follows. Wet snow weighs 7.5 times as much as dry snow, and unpruned trees break more. Shaking, pruning time, copper and insurance.
 Article
Should harvested olives be carried in crates or in sacks?
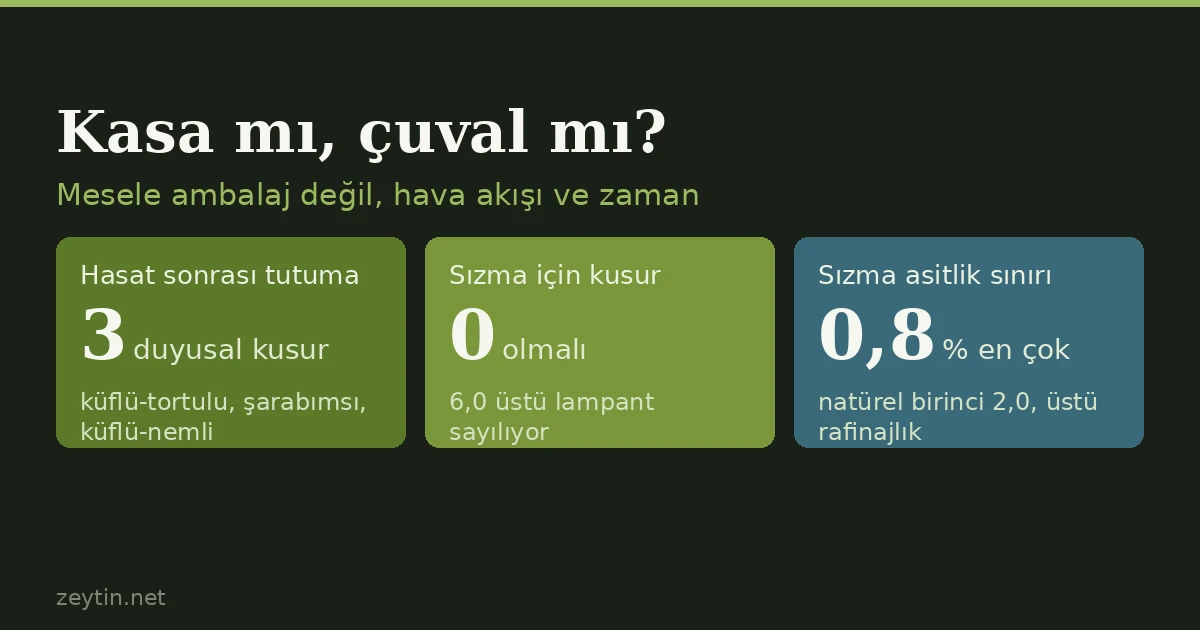
The cheapest decision of the harvest season is also one of the decisions that sets the grade of the oil. Three separate defects in the International Olive Council's vocabulary are defined directly by how the fruit was held after picking — and all three describe what a sack does.