Did olive oil go up 13.5 times, or 1.6 times?
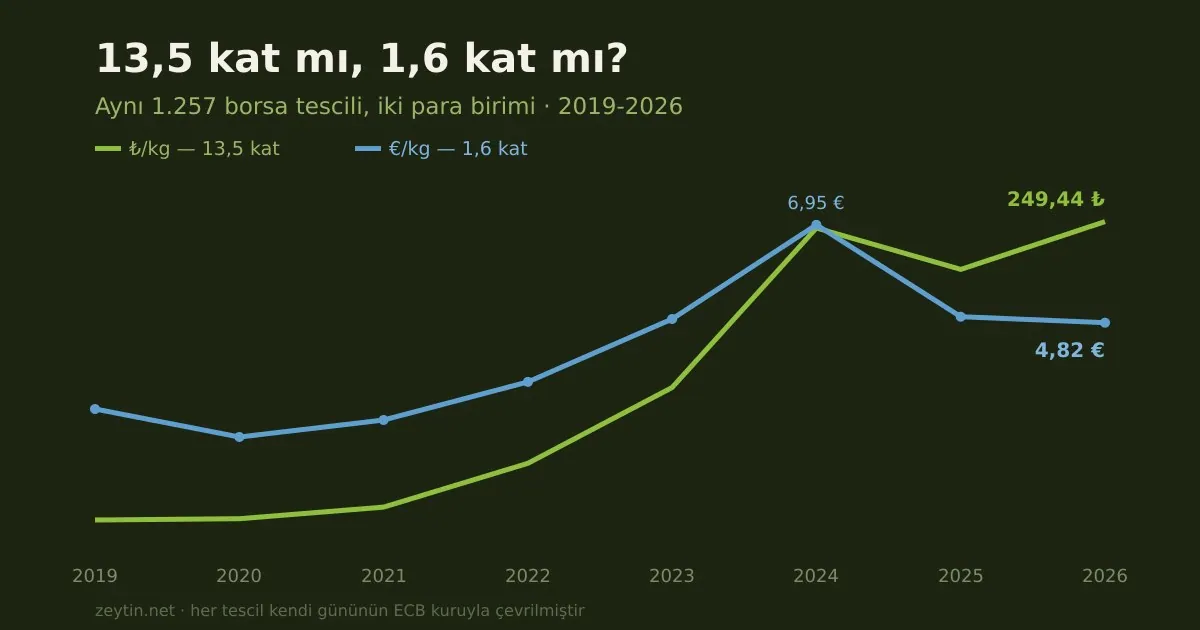
Up 13.5 times in lira, 1.6 times in euros. The same 1,257 registrations, each converted at its own day's ECB rate.
In 2019 a kilogram of extra virgin olive oil averaged 18.53 lira on Turkish commodity exchanges. Over the first eight months of 2026, the same product stands at 249.44 lira.
Thirteen and a half times.
The figure circulates widely and usually ends in the same sentence: olive oil has become a luxury. But before saying that, there is a question worth asking: how much of that 13.5× has anything to do with olive oil?
Our data can answer it, and the answer is surprising.
The same oil in three currencies
We converted each of 1,257 exchange registrations at the European Central Bank reference rate for the day it took place, into euros and dollars. Annual figures are then weighted by the volume traded.
The same oil. The same transactions. Only the unit of measure changes.
| Year | TL/kg | €/kg | $/kg | EUR/TRY |
|---|---|---|---|---|
| 2019 | 18.53 | 2.94 | 3.26 | 6.30 |
| 2020 | 19.59 | 2.33 | 2.69 | 8.42 |
| 2021 | 28.51 | 2.70 | 3.20 | 10.55 |
| 2022 | 62.46 | 3.53 | 3.65 | 17.72 |
| 2023 | 121.09 | 4.90 | 5.29 | 24.69 |
| 2024 | 244.45 | 6.95 | 7.53 | 35.17 |
| 2025 | 212.41 | 4.95 | 5.47 | 42.90 |
| 2026* | 249.44 | 4.82 | 5.62 | 51.79 |
* 2026 covers the first eight months. Each registration is converted at its own day's rate; annual values are volume-weighted. The last column is the average rate implied by that year's transactions.
Not 13.5×, but 1.6×
What the table says fits in three lines:
- Increase in Turkish lira: 13.5×
- Increase in euros: 1.6×
- Increase in dollars: 1.7×
In hard currency, olive oil rose by roughly 60-70% between 2019 and 2026. Everything beyond that — the bulk of the increase — is the currency losing value.
Over the same period EUR/TRY went from 6.30 to 51.79, a movement of 8.2× on its own. Multiply 8.2 by 1.6 and you get 13.1; that is where the 13.5× comes from.
This does not mean olive oil did not get more expensive. Even 60% in hard currency is not small. But the sentence "olive oil went up thirteen times" says nothing about olive oil. It says something about the lira.
The 2024 peak and after
The most interesting part of the table is the last three rows.
The most expensive year in hard currency is 2024, at €6.95 per kilogram. Since then the euro price has fallen to €4.82 — a decline of 31%.
Over the same period the lira price rose, from 244.45 to 249.44.
The two statements look contradictory and both are true. Measured in lira, olive oil has stood still; measured in hard currency, it has fallen by a third.
What that means depends on which currency you live in:
For an exporter: the product has become cheaper on world markets, which means competitiveness. But lira costs have not fallen at the same pace, so margins compress.
For a domestic consumer: olive oil has not become cheaper. Wages and the general price level have moved too, and only an inflation-adjusted calculation shows the real position.
For a grower: lira income looks preserved, but a large share of input costs — fertiliser, diesel, crop protection, packaging — is currency-linked. A falling hard-currency price is a direct loss of purchasing power.
2020: the year the price fell
One row is easy to miss. In 2020 the lira price rose from 18.53 to 19.59 while the euro price fell from €2.94 to €2.33 — down 21%.
That is the lowest hard-currency price in the entire series. The exchange rate moved from 6.30 to 8.42 in the same year.
2020 was, in other words, the year Turkish olive oil was cheapest on the world market — the most advantageous position it has held for exports. Whether that window was used is a separate question, but the table shows it was open.
Where the increase actually happened
The 13.5× rise is not spread evenly across seven years. In hard currency almost all of the movement is compressed into two.
From 2019 to 2022 the euro price went from €2.94 to €3.53: 20% over four years. The lira price over the same four years went from 18.53 to 62.46, a factor of 3.4. What happened in those four years was almost entirely currency.
The real break is 2023-2024. The euro price goes from €3.53 to €6.95 — double in two years. That cannot be explained by currency; it is a genuine price movement, and the cause is known: harvests fell across the Mediterranean and world supply tightened. Türkiye's price rose with the world price.
In 2025-2026 the movement reverses: as supply normalises, the euro price falls from €6.95 to €4.82.
The series is therefore three distinct periods: a currency period (2019-2022), a supply crisis (2023-2024) and a normalisation (2025-2026). Collapsing them into a single "up 13.5×" confuses three different phenomena.
You can run this yourself
There is no secret in this calculation, and its reproducibility matters to us.
The method: divide each registration's price by the ECB reference rate for the day of the transaction. When averaging by year, weight each transaction by its quantity.
Two traps to avoid:
Do not convert at the year-end rate. Converting a whole year's average price at the 31 December rate produces serious error in years when the currency moves fast. In 2024 that error runs into double-digit percentages.
Do not take a simple average. Counting a 700-tonne registration the same as a four-tonne one measures the frequency of records, not the market.
The raw data can be downloaded as CSV from our market page, and the ECB rate series from the bank's own site. If your result differs, we would like to hear about it.
This is not an inflation calculation
A caution is needed here, because exchange rates and inflation are not the same thing.
Measuring in hard currency shows a good's value on international markets. Adjusting for inflation shows its value against domestic purchasing power. The two usually move in the same direction but not by the same amount.
This article does the first. A full answer to "did olive oil really get more expensive in Türkiye" requires deflation by the consumer price index — carrying each registration forward by its own month's index.
For that we need a verified CPI series, and we have not obtained one yet. When we do, it will be published as a separate article. A calculation built on an unverified index produces a wrong chart, and a wrong chart is worse than no chart.
Summary
- Between 2019 and 2026 the lira price rose 13.5×, the euro price 1.6×, the dollar price 1.7×.
- Most of the increase is currency movement: EUR/TRY rose 8.2× over the same period.
- The most expensive year in hard currency was 2024 (€6.95/kg); the price has fallen 31% since.
- The cheapest year was 2020 (€2.33/kg) — the most favourable window for exports.
- This is a currency-based measure, not an inflation-adjusted one; that article follows once a CPI series is verified.
Raw data and current charts: market page
Related reading: Is Turkish olive oil cheap? · From olive to oil: the price gap · Two thirds of our exports are table olives
One rating per visitor; you can change yours at any time. Ratings are real reader votes — no seeded or default scores.
Related
 Article
Alternate bearing: one year yes, one year no
Olive oil output can swing from 40,000 to 200,000 tonnes. Why alternate bearing happens, how it breaks prices and exports, and how its amplitude can be reduced.
Article
Alternate bearing: one year yes, one year no
Olive oil output can swing from 40,000 to 200,000 tonnes. Why alternate bearing happens, how it breaks prices and exports, and how its amplitude can be reduced.
 Article
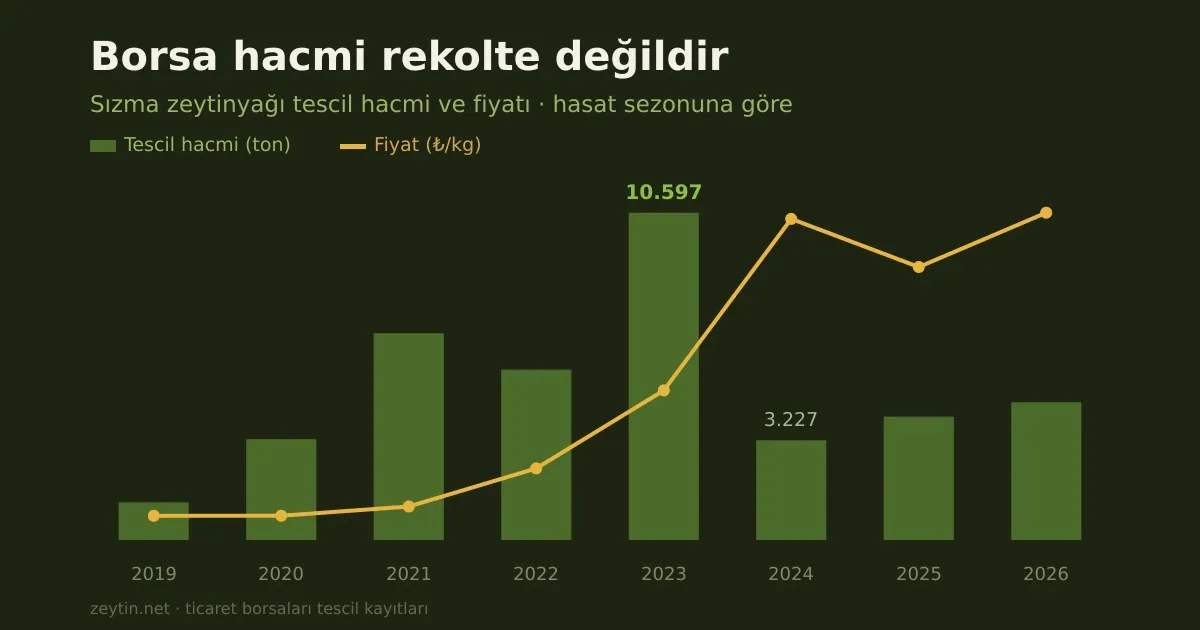
Exchange volume is not the harvest: what the 2023 record actually recorded
10,597 tonnes registered in 2023, down to 3,227 the next season. Harvest collapse or a change of channel? The data cannot tell them apart.
Article
Exchange volume is not the harvest: what the 2023 record actually recorded
10,597 tonnes registered in 2023, down to 3,227 the next season. Harvest collapse or a change of channel? The data cannot tell them apart.
 Article
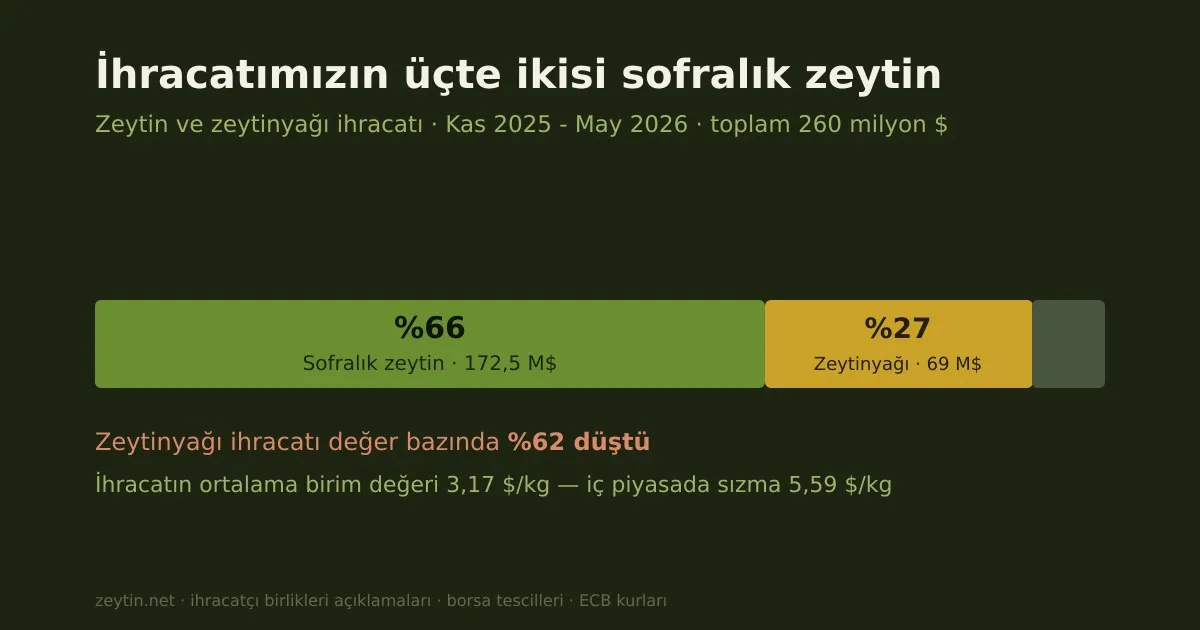
Two thirds of our exports are table olives: the $260 million picture
In 2025-26, 66% of exports were table olives and 27% oil. Average unit value $3.17/kg — the added value sits inside the packaging.
Article
Two thirds of our exports are table olives: the $260 million picture
In 2025-26, 66% of exports were table olives and 27% oil. Average unit value $3.17/kg — the added value sits inside the packaging.
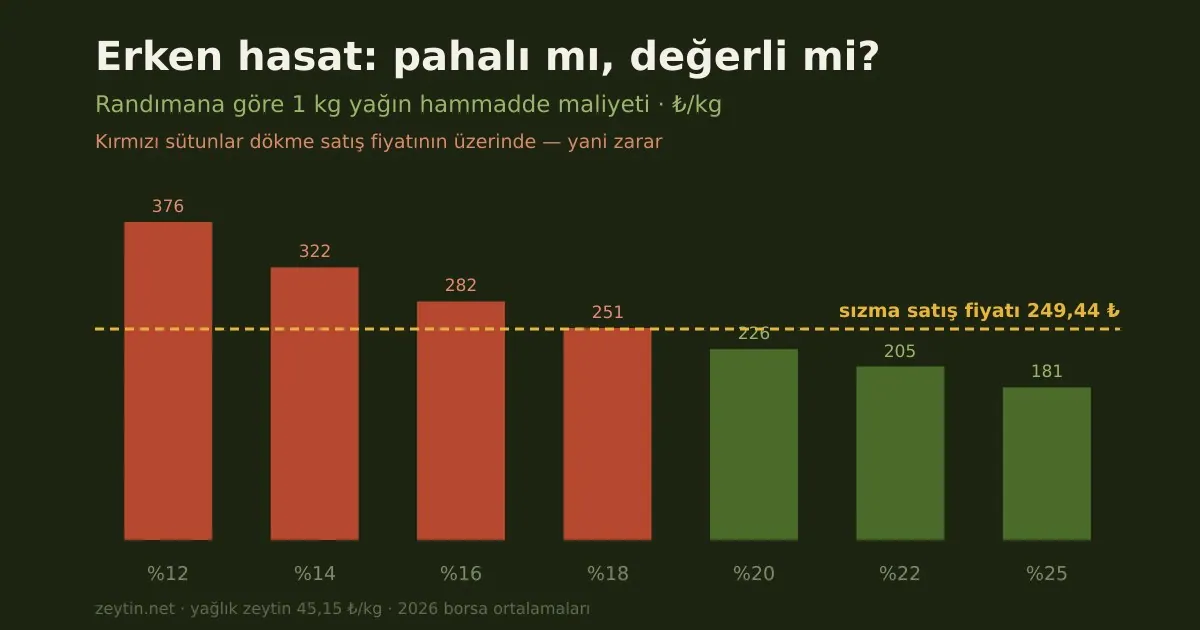 Article
Early harvest: expensive or valuable? The arithmetic of yield
Below 18% yield the raw material costs more than the bulk price. Early-harvest oil needs a 43% premium to break even.
Article
Early harvest: expensive or valuable? The arithmetic of yield
Below 18% yield the raw material costs more than the bulk price. Early-harvest oil needs a 43% premium to break even.