Was it six times? Seven years of the table olive gap
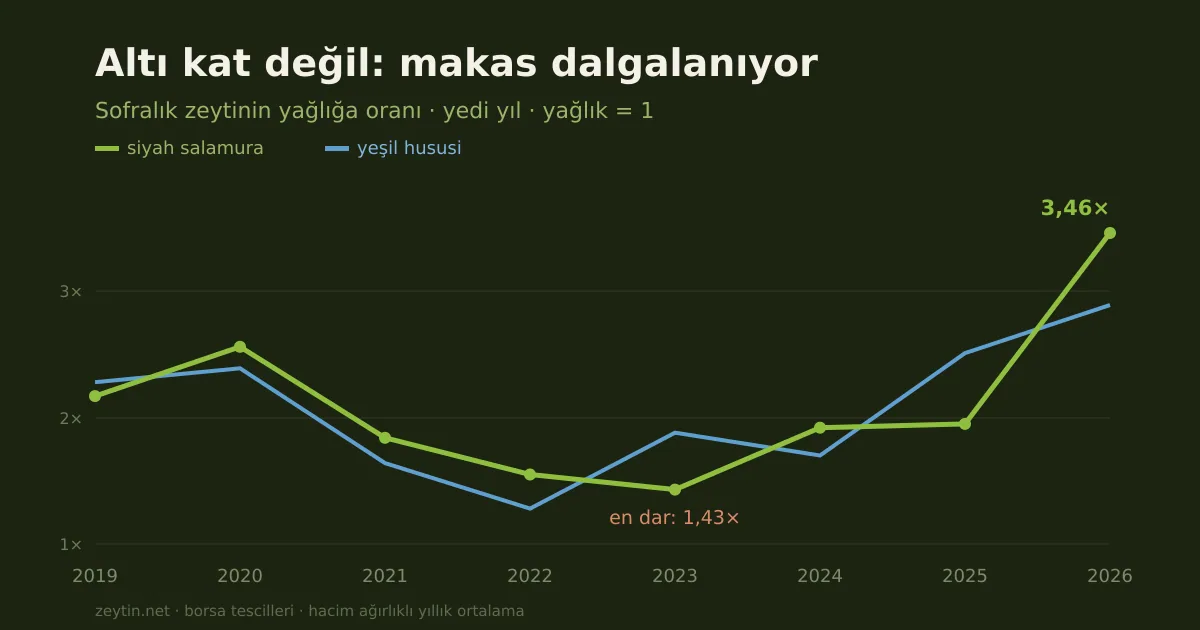
How many times the oil price does a table olive fetch? Over seven years the ratio ranged 1.43 to 3.46, never below 1.
Yesterday we published an article on this site saying: the same olive fetches 45 lira going to oil and 270 lira as large black table fruit — a sixfold gap. The figures were right, but they came from a single day's registrations.
Since then we have pulled seven years of history for those four products: 411 + 332 + 120 + 22 records. Now we can put the same question to a series.
The answer partly corrects what we wrote.
The gap is not fixed
| Year | Oil olives TL/kg | Black brined | Green select | Black extra-extra* |
|---|---|---|---|---|
| 2019 | 4.00 | 2.17× | 2.28× | 3.66× |
| 2020 | 3.76 | 2.56× | 2.39× | 5.88× |
| 2021 | 4.86 | 1.84× | 1.64× | 2.45× |
| 2022 | 12.04 | 1.55× | 1.28× | 2.75× |
| 2023 | 22.49 | 1.43× | 1.88× | 1.70× |
| 2024 | 39.24 | 1.92× | 1.70× | 1.33× |
| 2025 | 37.12 | 1.95× | 2.51× | 3.37× |
| 2026 | 45.15 | 3.46× | 2.89× | 5.98× |
* The black extra-extra series is very thin: between one and seven registrations a year. The 2024 and 2026 values rest on a single transaction and cannot be read as a series. Brined (13-86 records a year) and green select (20-66) are sounder. All values are volume-weighted annual averages.
What the table says: "six times" is not a rule, it is this year's situation.
The same ratio was 1.33 in 2024. In 2023 black brined olives were only 43% dearer than oil olives. Across seven years the brined-to-oil ratio moved between 1.43 and 3.46.
So what does hold?
Underneath the swing there is something constant: table olives are dearer than oil olives every single year. The ratio never fell below 1 in any year of the series. Even at its narrowest (2023, 1.43×) the table paid better.
So the core of yesterday's argument stands: setting fruit aside for the table is worth more than sending it to the mill. What was wrong was stating the size of that gap from one day's figure.
The accurate sentence: the table premium ranges from 1.4 to 3.5 times depending on the year; this year's 3.46 is the highest in the series.
Why does the gap open and close?
Reading the table row by row, a pattern emerges.
When oil olive prices rise fast, the gap narrows. In 2022 and 2023 oil olives rose 2.5-fold and 1.9-fold respectively — the two years with the narrowest gap. When world olive oil prices surged, oil-destined fruit gained value too and closed on the table grade. We measured that period separately.
When oil olives go flat, the gap widens. Through 2025 and 2026 oil olives held between 37 and 45 lira while table prices kept climbing; the ratio went from 1.95 to 3.46.
The logic: table and oil are tied to different markets. Oil olives follow the world olive oil price; table olives follow domestic consumption and table exports. They come from the same tree but do not move on the same wind.
What we measured in our export composition article shows here too: olive oil exports fell 62% while table olives held up. That resilience may itself be why the gap widened in 2026.
What it means for a grower
The decision is made afresh each year. Since the table premium ranges from 1.4 to 3.5 times, "table always pays better" is not enough — you have to ask whether this year's gap covers the processing cost. Brine, tanks, losses and months of storage can eat the margin in a narrow year.
This year the gap is wide. In 2026 brined olives run at 3.46 times oil olives. For a grower with a table-suitable variety, this is the most favourable year in the series.
Variety decides. Oil varieties like Memecik or Kilis Yağlık cannot make this choice at all. Our variety table shows which variety suits which use.
On correcting our own work
This article tests a finding from one of yesterday's articles and partly corrects it. We chose to make that visible, because there is a single rule on this site: a figure is written as it comes, and revisited when the data grows.
Yesterday's error was not an arithmetic one — it was generalising from a single observation. We have also placed a link to this table inside that article.
You can do the same to us: the raw data sits on our market page as CSV. If you reach a different result, we would like to hear it.
Summary
- The table-to-oil ratio moved between 1.43 and 3.46 over seven years — there is no fixed "six times".
- The ratio never fell below 1: table olives always outvalued oil olives.
- The gap narrows when oil prices surge (2022-2023) and widens when they go flat (2025-2026).
- The reason: table follows domestic demand, oil follows the world olive oil price — same tree, two markets.
- 2026 is the widest-gap year in the series; a favourable season for anyone with a table-suitable variety.
- The black extra-extra series is very thin (1-7 records a year) and should not be read alone.
Related reading: The same olive, six times the price · The economics of caliber · Two thirds of our exports are table olives · Prices exchange by exchange
One rating per visitor; you can change yours at any time. Ratings are real reader votes — no seeded or default scores.
Related
 Article
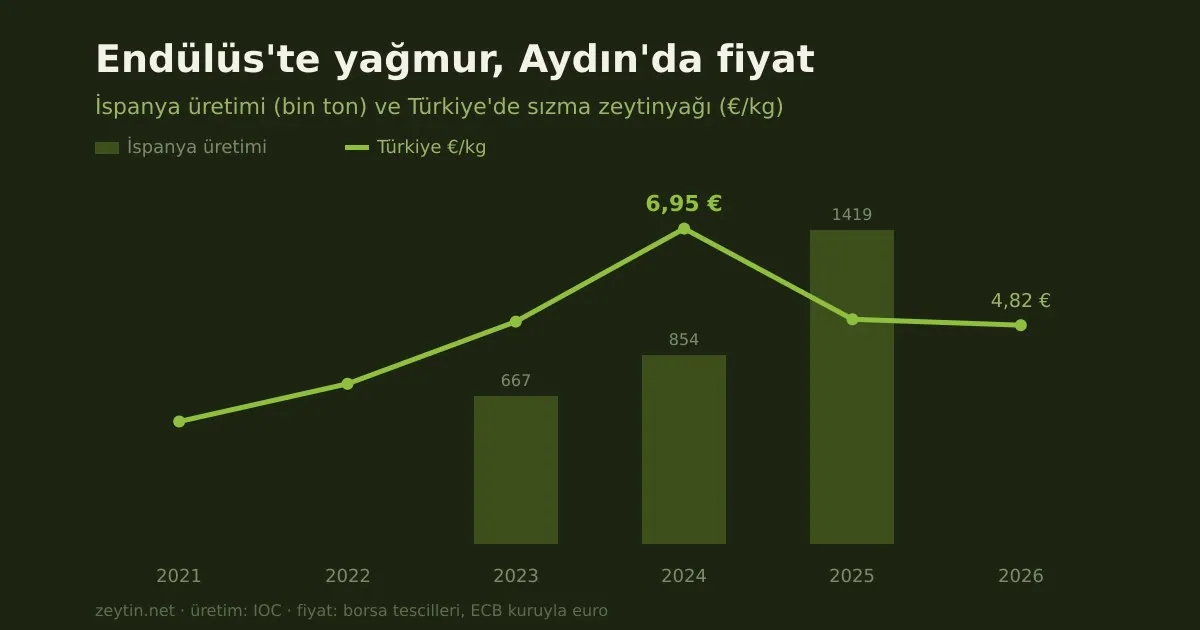
Rain in Andalusia, prices in Aydın: how Spain's drought set the price in Türkiye
Spain makes 40% of the world's olive oil. Its output halved in 2022/23 and Türkiye's euro price went from €2.70 to €6.95.
Article
Rain in Andalusia, prices in Aydın: how Spain's drought set the price in Türkiye
Spain makes 40% of the world's olive oil. Its output halved in 2022/23 and Türkiye's euro price went from €2.70 to €6.95.
 Article
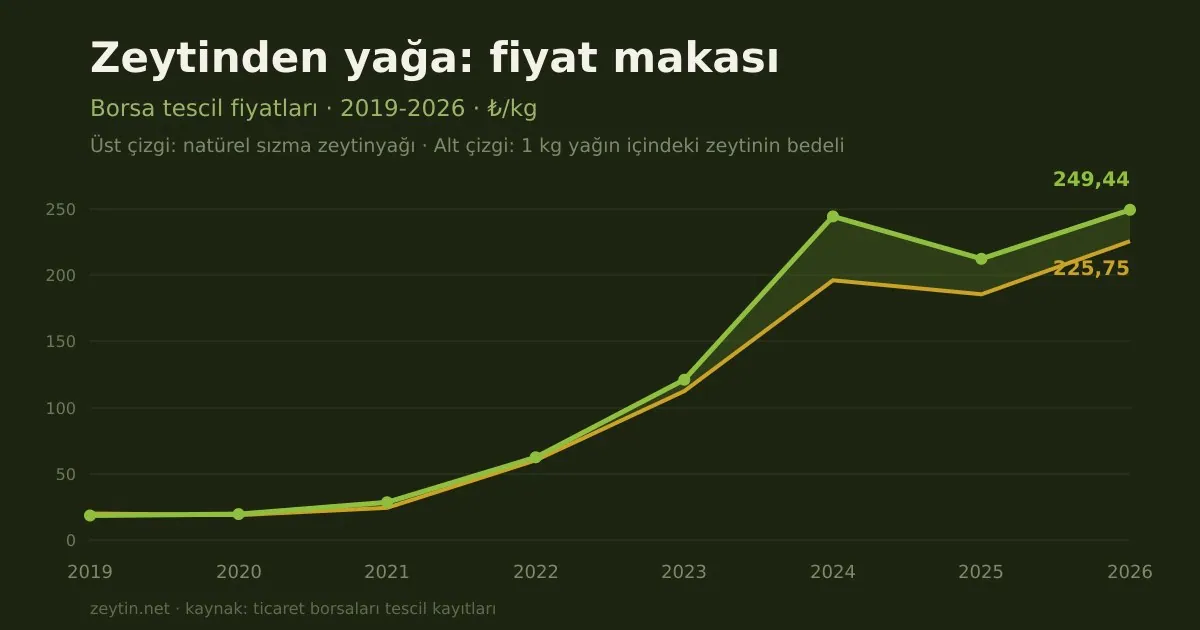
From olive to oil: the price gap, 2019-2026
The gap between a kilo of olives and a kilo of oil, measured from exchange registrations. Why it widens, and who gains.
Article
From olive to oil: the price gap, 2019-2026
The gap between a kilo of olives and a kilo of oil, measured from exchange registrations. Why it widens, and who gains.
 Article
Oleotourism: a grove's second income
What is olive oil tourism, how does it work elsewhere, and why has it not developed in Türkiye? Oleotourism, from the literature.
Article
Oleotourism: a grove's second income
What is olive oil tourism, how does it work elsewhere, and why has it not developed in Türkiye? Oleotourism, from the literature.
 Article
Olive oil trade in the Ottoman Empire: Britain the buyer, the crop the price
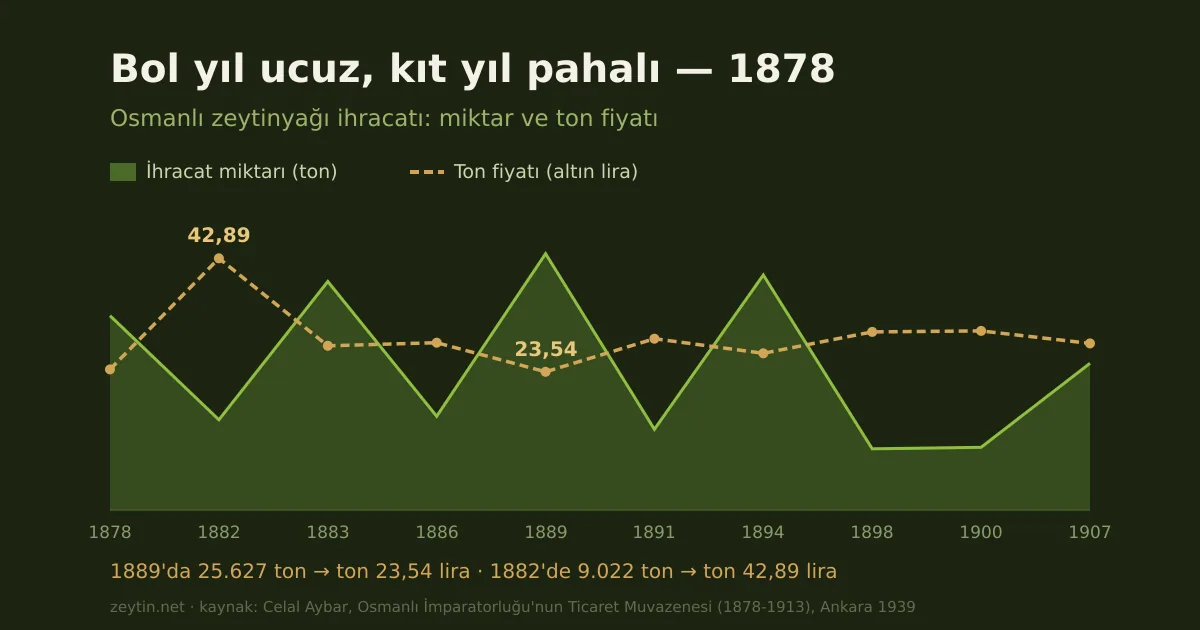
25,627 tonnes exported in 1889 at 23.54 lira a tonne; 9,022 tonnes in 1882 at 42.89. The crop-price inverse held a century ago too.
Article
Olive oil trade in the Ottoman Empire: Britain the buyer, the crop the price
25,627 tonnes exported in 1889 at 23.54 lira a tonne; 9,022 tonnes in 1882 at 42.89. The crop-price inverse held a century ago too.