The profitability problem in olive oil exports
Turkey sold to the US at $3,492 a tonne while the world average was $4,235 - the furthest supplier and the cheapest. The EU tariff wall, the Tunisia comparison, and the method none of 17 exporters knew.
For a long time Turkey occupied an odd position in olive oil exports: the product was good, the price competitive — and precisely because of that, it was always the side selling cheapest.
An academic study published in 2015 set this out in figures and located the cause somewhere unexpected: in information.
The tables below cover 2011-2014. The figures have aged — but as the end of this article shows, the mechanism they identify has not. First that period's photograph, then today.
The US table: furthest country, lowest price
In 2013 the United States imported 188,741 tonnes of pure olive oil from the world. The per-tonne prices the exporting countries obtained:
| Exporter | 2011 | 2012 | 2013 | 2013 volume (t) |
|---|---|---|---|---|
| Italy | 4,038 | 3,725 | 4,479 | 96,304 |
| Greece | 4,486 | 4,091 | 4,354 | 6,819 |
| World average | 3,738 | 3,428 | 4,235 | 188,741 |
| Spain | 3,407 | 3,071 | 4,208 | 35,235 |
| Tunisia | 3,221 | 2,812 | 3,802 | 21,331 |
| Argentina | 2,913 | 2,780 | 3,515 | 8,186 |
| Turkey | 4,414 | 3,199 | 3,492 | 10,337 |
Two things stand out:
Turkey takes one of the lowest prices on the list — 743 dollars below the world average and nearly a thousand below Italy.
And Turkey is the country on this list geographically furthest from the United States. The side with the highest freight cost sells the same product for the least.
In 2011 Turkey's price was 4,414 dollars — top of the list. Within two years it fell to 3,492. Over the same period Italy rose from 4,038 to 4,479.
The EU door: a tariff wall
Turkey's difficulty in the EU has a structural cause. The EU applies a specific customs duty to olive oil arriving from third countries:
| Origin | Status | Duty |
|---|---|---|
| Other countries | third country | €124.50 / 100 kg |
| Turkey | tariff preference | €112.05 / 100 kg |
Turkey has a tariff preference — but that only means the wall is slightly lower. The fixed tariffs by product group:
| Description | Duty |
|---|---|
| Crude olive oil | 1,102 |
| Pure lampante | 1,226 |
| Virgin and extra virgin | 1,245 |
| Other non-virgin olive oils | 1,346 |
| Other | 1,603 |
The history of these tariffs is itself interesting: until 1995 the EU applied variable levies alongside a 20% customs duty. Under the WTO Agreement on Agriculture, fixed tariffs replaced the variable levies from 1 July 1995, and those tariffs were cut by 20% between 1995 and 2001.
The Tunisia comparison: the real issue
Turkey's largest competitor in the EU is Tunisia. And the comparison is uncomfortable:
| Country | Volume | Unit price | Customs status | Distance |
|---|---|---|---|---|
| Tunisia | 36,278 t | $3,116/t | exempt | very close |
| Turkey | 9,532 t | $2,892/t | dutiable | far |
Turkey pays the duty, ships from further away, and sells for less.
Tunisia, though exempt from duty and geographically very close to Spain, markets its product at a higher price than Turkey.
Quality does not explain this — the study treats the two countries' olive oil as comparable in quality. The difference lies in pricing and in how the market is entered.
The missed market: the United States
The US accounts for 799 million dollars of world olive oil imports. Turkey's share of that is 27 million dollars.
That leaves a gap of 772 million.
And the duty the US applies is close to nothing:
| Item | Rate |
|---|---|
| Ad valorem | 0% |
| Specific | $0.05/kg |
Five cents a kilo. Set against the EU's wall of €1.12 per kilo, that is an open door in practice.
World olive oil demand rose 22% between 2012 and 2013 — growth of more than a billion dollars. Turkey's total exports that year were 141 million dollars. A single year's growth in demand was more than seven times Turkey's entire export trade.
The cause: a technique nobody knew
The study's most concrete finding comes from a field survey.
Seventeen olive oil exporters in Gaziantep were asked what trade intelligence and competitive intelligence are, and whether they used these channels in target-market research.
t; All seventeen said they were unaware of these techniques.
Trade intelligence is not complicated: using international trade databases to see who the actual importers in a target market are, how much they import, and what average price they pay to each supplying country.
That information converts directly into price at the negotiating table. An exporter who knows what competitors are charging can set their own price accordingly.
The pilot: a 35-cent difference
The study tested the method with a single firm.
The firm was selling its product to Spain at $3.10. Database research showed it could sell the same product to the United States for at least $3.45, and it sent samples to identified importers.
The difference per kilogram: $0.35.
The firm's annual export volume is 180,000 kg. The gain from changing market alone:
t; 180,000 kg × $0.35 = $63,000
One firm, one year, with no change to production whatsoever.
Where we are today
More than a decade has passed and Turkey's position has changed in several respects.
| Season | Volume | Revenue | Unit (calculated) |
|---|---|---|---|
| 2023/24 | 70,626 t | $505m | ≈$7,150/t |
| 2024/25 | 50,713 t | $252m | ≈$4,969/t |
Three things have changed:
1. Turkey's production standing has risen. With a 475,000-tonne olive oil crop in 2024/25 Turkey stood second in the world behind Spain. On the table olive side it became world leader for the first time in its history.
2. Price levels are well above 2013. Oil sold to the US at $3,492 in 2013 now moves in a band of roughly $5,000-7,000. Most of that comes from the general rise in world prices — with the record 2024/25 crop prices began to retreat, and the per-tonne drop between the two seasons reflects that.
3. The number of markets has grown. Olive oil now goes to 120 countries. Exports to Australia, Canada and the United States rose 17%, from 21,460 to 25,202 tonnes.
But two findings still stand
The US gap has not closed. With annual consumption of 375,000 tonnes the United States is the world's second-largest olive oil market. Turkey's combined exports to the US, Canada and Australia come to 25,202 tonnes — the three together amount to about one fifteenth of US consumption alone. The potential identified in 2013 remains largely untapped.
Bulk selling continues. With restrictions lifted and quotas granted, bulk and barrel olive oil exports were recorded at 100 million dollars. A significant share of export revenue therefore comes from unbranded, unpackaged oil — value handed to someone else.
The 2015 study's figures have aged, but its question has not: is Turkey selling its product at the highest price it could get?
The field study in Mut offers an answer from 2025 — and it is not encouraging: all eight enterprises that want to export have websites that are Turkish only and lira only.
The takeaway
Turkey's profitability problem in olive oil exports has two layers:
The structural layer: the EU's tariff wall is real and not something Turkey can remove on its own. That wall makes Europe — the world's largest and fastest-growing import market — unattractive for Turkey.
The behavioural layer: even in markets where no wall exists, Turkey sells cheapest. The reason is not knowing the price level in the target market. This layer is not structural — it is a matter of training and habit.
The second layer can be fixed far faster than the first. And that is exactly what the study recommends: trade intelligence courses for exporting firms.
Other structural problems in the sector: structural problems of Turkish olive growing · quality in table olives · problems of the grower
Sources
- Mete, M. (2015) — The Importance of Trade Intelligence and Target Market Selection for More Profitable Olive Oil Exports from Turkey, Journal of Social Sciences 14(2): 371-386
- International Trade Centre — export/import unit prices by country, 2011-2013
- Market Access Database — EU tariff and duty rates
- US International Trade Commission — US duty rates
- Tan, S. & Çelikel, F. (2003) — EU olive oil policy
- Aegean Exporters' Associations / sector reports (2024-2025) — current export volume and revenue
- IOC — world olive oil production and consumption data
Note: The price and export figures in this article are from 2011-2014 and are given for historical comparison. Current tariffs should be checked against official sources. The current position is covered separately in the "Where we are today" section. The article's central point — the tariff wall and the gap in market knowledge — is independent of those dates.
One rating per visitor; you can change yours at any time. Ratings are real reader votes — no seeded or default scores.
Related
 Article
The table olive sector: 461 registered, 8,000 unregistered
Turkey has become the world's leading table olive producer, with a record $255.3m in 2024-25 across 117 countries. Yet only one enterprise in twenty is registered.
Article
The table olive sector: 461 registered, 8,000 unregistered
Turkey has become the world's leading table olive producer, with a record $255.3m in 2024-25 across 117 countries. Yet only one enterprise in twenty is registered.
 Article
Was it six times? Seven years of the table olive gap
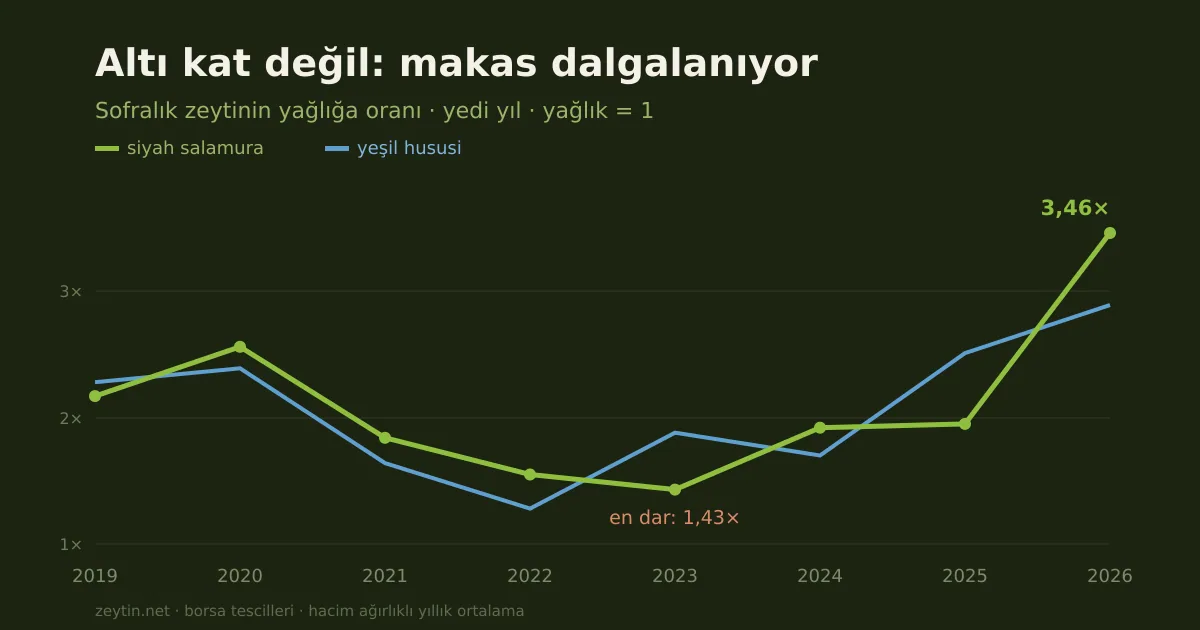
How many times the oil price does a table olive fetch? Over seven years the ratio ranged 1.43 to 3.46, never below 1.
Article
Was it six times? Seven years of the table olive gap
How many times the oil price does a table olive fetch? Over seven years the ratio ranged 1.43 to 3.46, never below 1.
 Article
Olive oil trade in the Ottoman Empire: Britain the buyer, the crop the price
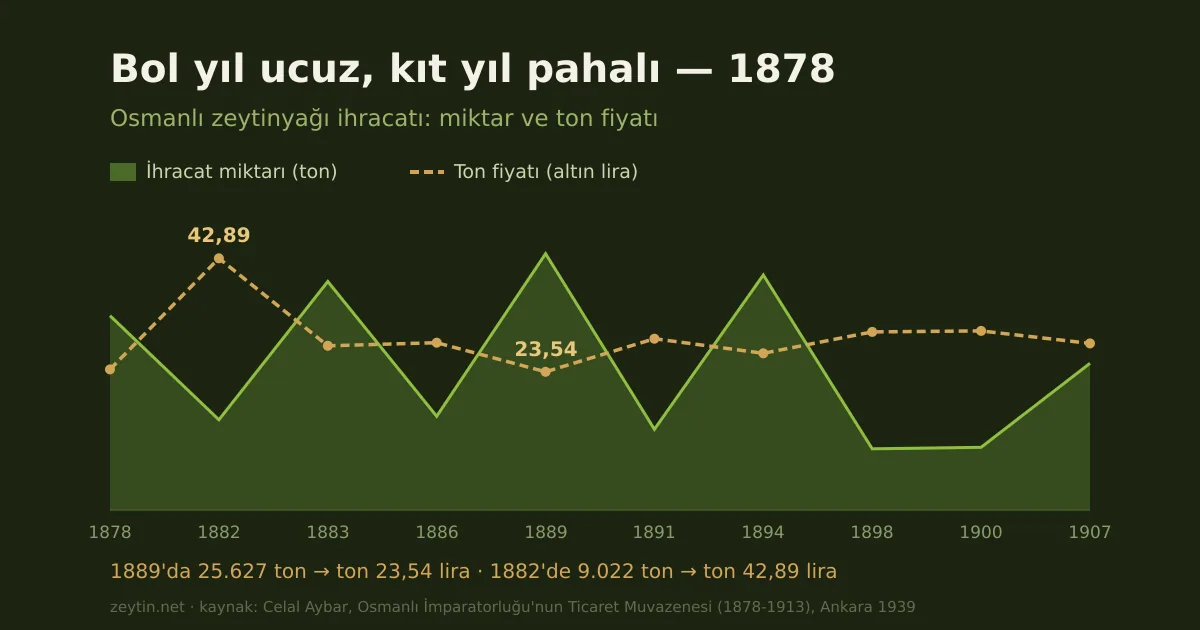
25,627 tonnes exported in 1889 at 23.54 lira a tonne; 9,022 tonnes in 1882 at 42.89. The crop-price inverse held a century ago too.
Article
Olive oil trade in the Ottoman Empire: Britain the buyer, the crop the price
25,627 tonnes exported in 1889 at 23.54 lira a tonne; 9,022 tonnes in 1882 at 42.89. The crop-price inverse held a century ago too.
 Article
Oleotourism: a grove's second income
What is olive oil tourism, how does it work elsewhere, and why has it not developed in Türkiye? Oleotourism, from the literature.
Article
Oleotourism: a grove's second income
What is olive oil tourism, how does it work elsewhere, and why has it not developed in Türkiye? Oleotourism, from the literature.