From olive to oil: the price gap, 2019-2026
The gap between a kilo of olives and a kilo of oil, measured from exchange registrations. Why it widens, and who gains.
In 2019, a kilogram of extra virgin olive oil averaged 18.53 lira on the Aydın and Edremit commodity exchanges. Over the first eight months of 2026, the volume-weighted average for the same product is 249.44 lira. Thirteen times higher in seven years.
On its own that figure says very little. Everything else grew more expensive over the same years. The question worth asking is a different one, and the answer is sitting in our data: how much of that money goes to the fruit?
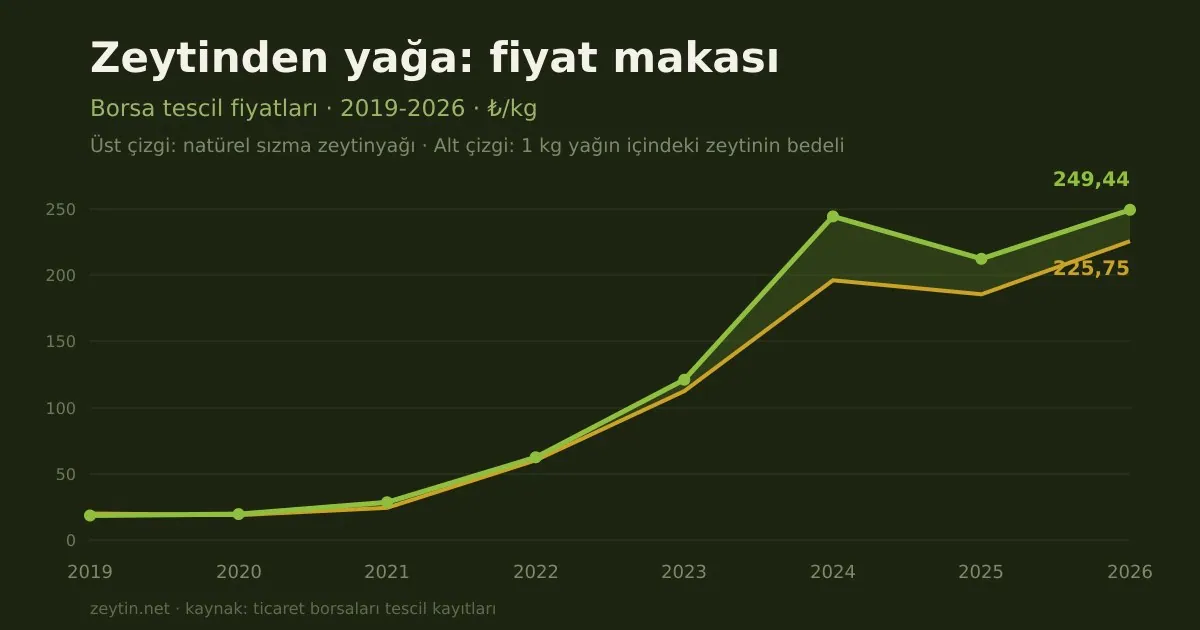
Olive oil is the agricultural product where this question can be put most cleanly, because it has a single raw material. Nothing is blended into it the way flour is blended, nothing is diluted the way milk is. A given quantity of fruit yields a given quantity of oil, and the gap between the two prices is shared out among milling, transport, storage and profit. If we can measure that gap, we can also see where the sector makes money and where it does not.
Where the data comes from
Every figure in this article comes from sales actually registered on commodity exchanges. Not a survey, not a declaration, not an estimate: transactions signed by a buyer and a seller, with quantity and price entered into the record.
We use two series:
- Extra virgin olive oil — the Aydın, Edremit, Nazilli, Gaziantep and Bandırma exchanges, 1,257 registrations from January 2019 to August 2026, totalling roughly 39,000 tonnes.
- Olives for oil — the Edremit Commodity Exchange alone, 120 registrations from November 2019 to June 2026, totalling roughly 22,000 tonnes.
Annual figures are volume-weighted, not simple averages. If a 700-tonne registration counts the same as a four-tonne one, what you end up measuring is the frequency of record-keeping rather than the market.
The series has two limits, and they are worth stating at the outset. First, the olive price comes from a single exchange; Edremit's prices are not a national average, though the series is long and unbroken enough to read the direction from. Second, with between four and twenty-five registrations a year, the olive side is considerably less precise than the oil side. Read the table below as a series that shows a direction, not as a set of exact annual values.
Five kilos of olives, one kilo of oil
The bridge between the two prices is simple. The share of the fruit's weight that becomes oil is called the yield; it varies with variety, ripeness and extraction method, but generally falls between 15% and 25%. Taking 20% as a working figure, one kilogram of oil requires five kilograms of olives.
So the value of the fruit inside a kilogram of oil is five times the price of a kilogram of olives. Calculate that for each year, divide it by the same year's extra virgin price, and you get the share of the selling price that is raw material.
| Year | Olives for oil | Raw material in 1 kg of oil (×5) | Extra virgin oil | Raw material share |
|---|---|---|---|---|
| 2019 | 4.00 | 20.00 | 18.53 | 108% |
| 2020 | 3.76 | 18.80 | 19.59 | 96% |
| 2021 | 4.86 | 24.30 | 28.51 | 85% |
| 2022 | 12.04 | 60.20 | 62.46 | 96% |
| 2023 | 22.49 | 112.45 | 121.09 | 93% |
| 2024 | 39.24 | 196.20 | 244.45 | 80% |
| 2025 | 37.12 | 185.60 | 212.41 | 87% |
| 2026* | 45.15 | 225.75 | 249.44 | 90% |
* 2026 covers the first eight months of the year. The raw material share assumes a 20% yield.
The margin is far narrower than it looks
What the table says is this: between 80% and 108% of the money paid for a kilogram of extra virgin olive oil on the exchange is the price of the fruit alone.
Everything else has to come out of the narrow strip that remains: hauling the fruit from grove to mill, washing and crushing, malaxation, centrifuging, disposing of the pomace, storage in stainless tanks, losses, laboratory analysis, the cost of financing the operation, and finally profit.
Averaged across seven years that strip is around 10%. All the value created at the milling stage is compressed into a space roughly a tenth of the cost of the fruit.
The wrong conclusion to draw is that millers are not making money. Mills generally do not press their own olives; they charge a fee for the service or retain a share of the product. The narrow margin in the table belongs to whoever buys olives, turns them into oil and sells it in bulk — the most exposed position in the sector, and these figures show just how exposed it is.
The real profit begins where this table ends. Buying bulk extra virgin at the exchange price, bottling it, labelling it and putting a brand on it is a stage entirely outside these numbers; the distance between the shelf price and the 249 lira here is territory this article does not measure.
2019: the year the fruit cost more than the oil
The strangest line in the table is the first one. In 2019 the calculated raw material cost (20.00 TL) comes out higher than extra virgin olive oil itself (18.53 TL). On paper, anyone buying olives to make oil that year lost money.
It would be wrong to leave that unexplained. There are three parts to it.
First, the 2019 olive data consists of just four registrations, all from November and December — the busiest weeks of the harvest. Prices from that window do not represent the whole year.
Second, yield is not fixed. In a high-yield season four kilos of olives may be enough for a kilo of oil rather than five, which cuts the raw material share by a fifth outright.
Third, and most importantly, olives and oil are not priced at the same moment. Olives are sold in November; the oil made from them may not change hands until March or June of the following year. When prices are rising quickly that lag works in your favour, and when they fall it works against you.
This is why the trend matters more than any single year. And the trend is clear: the raw material share fell from 108% in 2019 to 80% in 2024, then climbed back to around 90%.
2024: the widest margin in the series
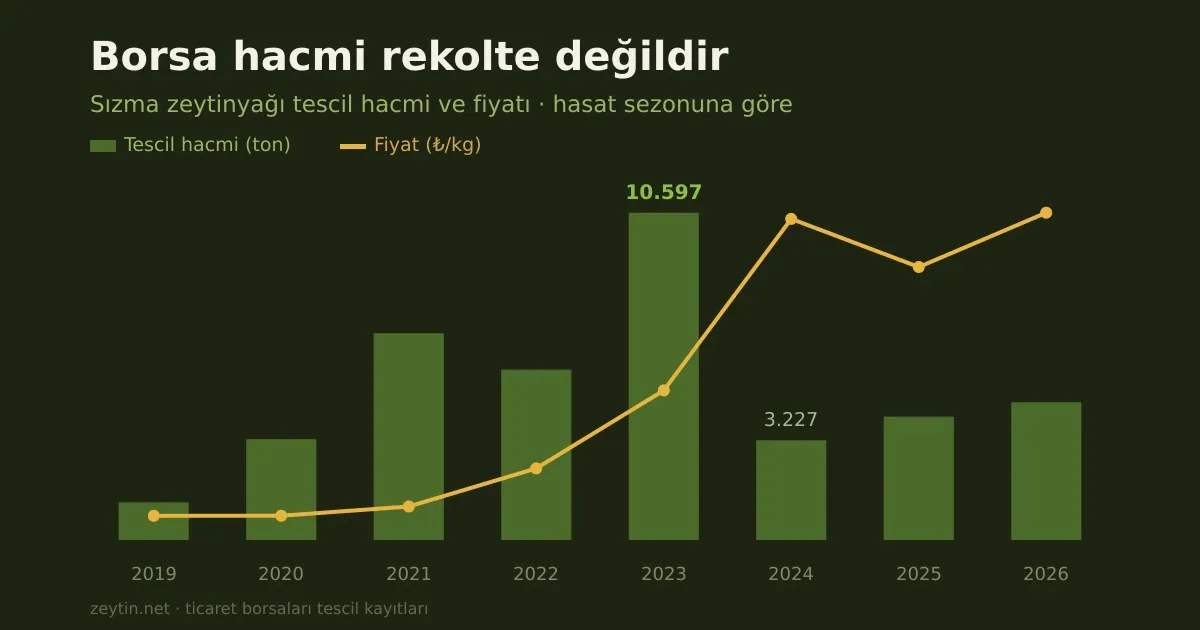
2023 was a record year for Turkish olive oil. Exchanges registered 10,346 tonnes of extra virgin — the highest volume in the series. The following year that figure fell to 3,182 tonnes, a third of it.
Over the same period the raw material share dropped from 93% to 80%. 2024 was, in other words, the most comfortable year for anyone buying olives and selling oil: the price of oil rose quickly while the price of olives failed to keep pace.
In 2025 the gap narrowed again (87%), and it narrowed further over the first eight months of 2026 (90%). Olive prices are catching up with oil prices. That is good news for the grower and bad news for the processor.
Does waiting pay?
Anyone selling olive oil eventually asks it: sell as soon as the harvest ends, or hold on and wait for prices to rise in the spring?
Our 92-month series is long enough to answer that directly. But there is an easy trap here, and it is worth showing first.
Divide each month's average by the average of the year it belongs to and you get a table like this: December sits at 131% of the annual average, March at 88%. Anyone reading those numbers concludes that selling in December is roughly half again as profitable as selling in March.
That conclusion is wrong, because what it measures is not seasonality but inflation. In an economy where prices rise continuously through the year, December comes out above January simply by being later. It has nothing to do with olives, harvests, supply or demand.
To measure seasonality properly, the price has to be separated from its trend. Dividing each month by the 13-month centred moving average it sits in the middle of — that is, taking the general rise out of the equation — changes the picture completely:
| Month | Index | Month | Index |
|---|---|---|---|
| January | 104.0 | July | 98.4 |
| February | 100.4 | August | 100.7 |
| March | 98.5 | September | 96.0 |
| April | 97.9 | October | 101.3 |
| May | 97.9 | November | 100.2 |
| June | 100.7 | December | 104.1 |
92 months, 2019-2026; median of each month's ratio to its 13-month centred moving average.
The whole year is compressed between 96 and 104. The lowest month is September, the highest December, and the distance between them is eight per cent.
The meaning is plain: there is no seasonal price pattern in olive oil worth acting on. Whatever you gain by holding oil for six months is negligible next to the storage, financing and quality loss you pay over the same period. What determines the price is the year's harvest and the general price level, not the name of the month.
That December and January come out slightly high is itself the opposite of what you would expect — these are the months when the harvest has just finished and supply is at its most abundant. The likely explanation is that lots registered in that window are fresh-crop oil and carry a quality premium. But the difference is not large enough to build a strategy on.
2023: the break in the series
Every movement in these tables turns around a single year.
High volume and high prices landing in the same year looks like a contradiction at first — abundant supply is supposed to push prices down. The explanation lies on the demand side rather than the supply side. 2023 was a year when production across the Mediterranean fell sharply and Spain was struggling with drought. Turkish oil found buyers at home and abroad, trade accelerated, and registered volume hit a record.
The following year's fall to 3,182 tonnes is the continuation of that story. But caution is needed: the volume registered on an exchange is not the volume produced. The drop could reflect a smaller harvest, or trade moving outside the exchanges. In a period when export restrictions were under discussion, the second possibility cannot be dismissed. Our data does not separate the two, so we do not choose between them.
Do not confuse kilograms with litres
All of these calculations are in kilograms, because exchange registrations are made in kilograms. But olive oil is sold to consumers in litres, and the two are not the same thing.
The density of olive oil at 20 °C is roughly 0.916 kg/L. A kilogram of oil is therefore about 1.09 litres, and a litre of oil weighs 916 grams.
In 2026 terms: bulk extra virgin at 249.44 lira per kilogram works out at 228.49 lira per litre. The 225.75 lira of fruit in a kilogram of oil is the raw material for 1.09 litres, or 206.84 lira per litre.
Overlooking this distinction means a systematic nine per cent error in any business buying by the tonne. To run your own figures, use our yield calculator: it converts a quantity of olives into oil in both kilograms and litres, and works out the raw material cost from the current exchange price.
What a grower should take from this
For anyone with a grove, the question underneath all of this is whether to sell the olives or sell the oil.
The table does not answer that on its own, but it draws the boundary. In years when the raw material share climbs above 90%, selling the fruit as it is makes more sense than taking on the risk of milling, because what milling returns barely covers what it costs. In years when the share falls towards 80%, pressing and holding becomes worthwhile.
Through the first half of 2026 the share is running at around 90%. We are in a period where the milling margin is historically narrow.
One qualification: this applies to bulk sales. A grower who bottles their own oil and sells it directly is playing on an entirely different table, and the margin there is several times the one described here.
What this article does not claim
We are not asserting any of the following:
- Real growth. 249 lira is thirteen times the 18 lira of 2019, but the general price level rose over those same years too. How much of that increase is real requires a separate, inflation-adjusted calculation; that article will be published once we have a verified consumer price index series.
- A national average. The olive data comes from a single exchange. Prices in other Aegean basins and in the southeast may differ.
- Harvest size. Volume registered on an exchange is not volume produced. The threefold drop in 2024 may reflect the harvest, or trade moving off-exchange. Our data cannot tell the two apart.
- Retail. Every price here is bulk, wholesale, exchange-registered. It cannot be compared directly with the label you see in a shop.
Sources and related pages
The price series are compiled from the open registration records of commodity exchanges affiliated with the Union of Chambers and Commodity Exchanges of Türkiye (TOBB). Current prices and charts running back to 2019 are on our market page, where the raw data can also be downloaded as CSV.
Related reading: How cold-pressed olive oil is made · The olive harvest: when and how · What acidity means in olive oil · Weekly price bulletin
One rating per visitor; you can change yours at any time. Ratings are real reader votes — no seeded or default scores.
Related
 Article
Exchange volume is not the harvest: what the 2023 record actually recorded
10,597 tonnes registered in 2023, down to 3,227 the next season. Harvest collapse or a change of channel? The data cannot tell them apart.
Article
Exchange volume is not the harvest: what the 2023 record actually recorded
10,597 tonnes registered in 2023, down to 3,227 the next season. Harvest collapse or a change of channel? The data cannot tell them apart.
 Article
The same olive, six times the price: the quiet advantage of table olives
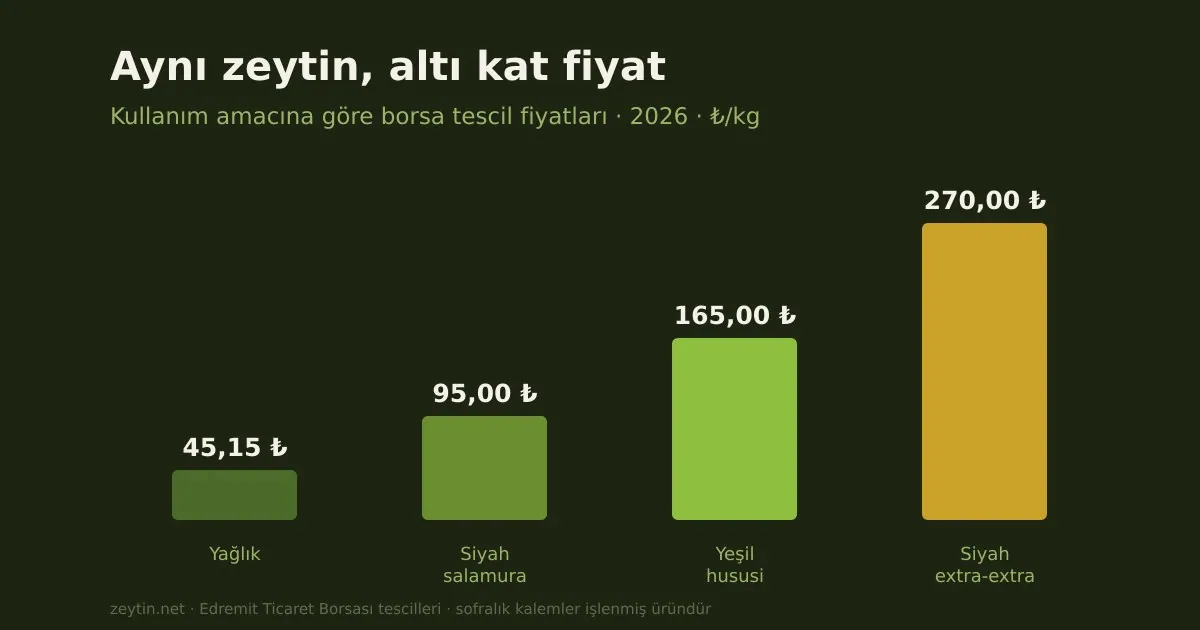
How much more does the same fruit fetch as a table olive than for oil? Measured over seven years of exchange data: 1.43 to 3.46 times.
Article
The same olive, six times the price: the quiet advantage of table olives
How much more does the same fruit fetch as a table olive than for oil? Measured over seven years of exchange data: 1.43 to 3.46 times.
 Article
Olive Oil Prices: Week 37 of 2026
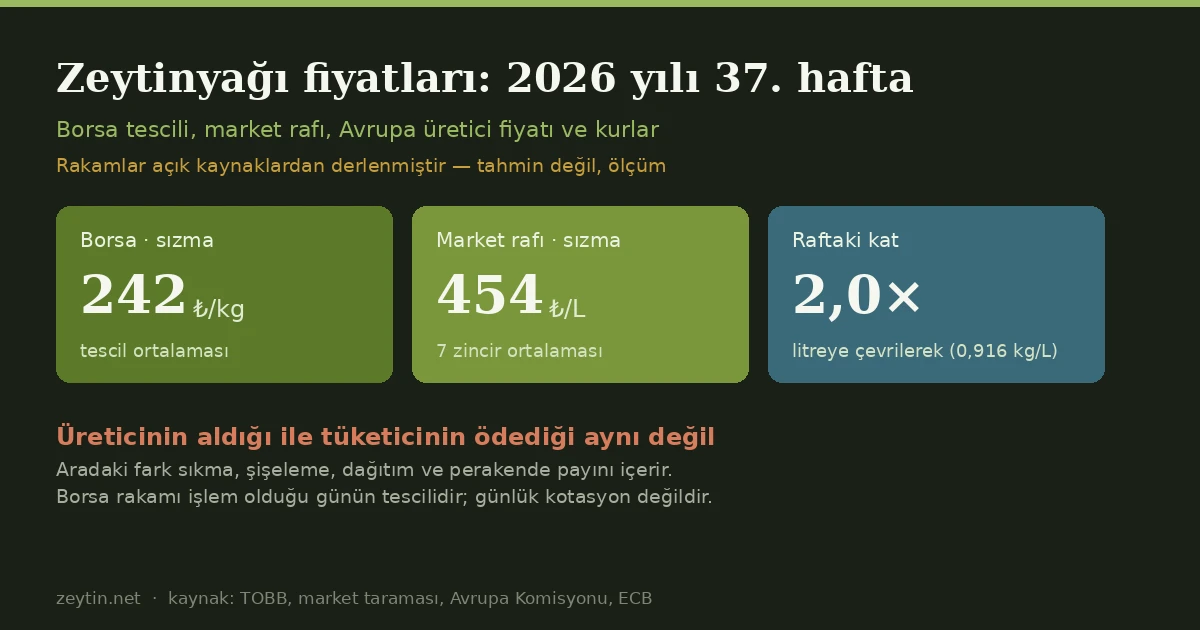
Week 37 of 2026: Turkish exchange prices, European producer prices and exchange rates side by side.
Article
Olive Oil Prices: Week 37 of 2026
Week 37 of 2026: Turkish exchange prices, European producer prices and exchange rates side by side.
 Article
Solar panels above the grove: energy without cutting trees?
In Spain, 5,150 solar modules were raised four metres above a working olive grove without removing a single tree. The height is set not by the trees but by a harvester that opens to 3.5 metres. A University of Córdoba model puts joint output at 789 kg of oil and 891 MWh per hectare.
Article
Solar panels above the grove: energy without cutting trees?
In Spain, 5,150 solar modules were raised four metres above a working olive grove without removing a single tree. The height is set not by the trees but by a harvester that opens to 3.5 metres. A University of Córdoba model puts joint output at 789 kg of oil and 891 MWh per hectare.