Exchange volume is not the harvest: what the 2023 record actually recorded
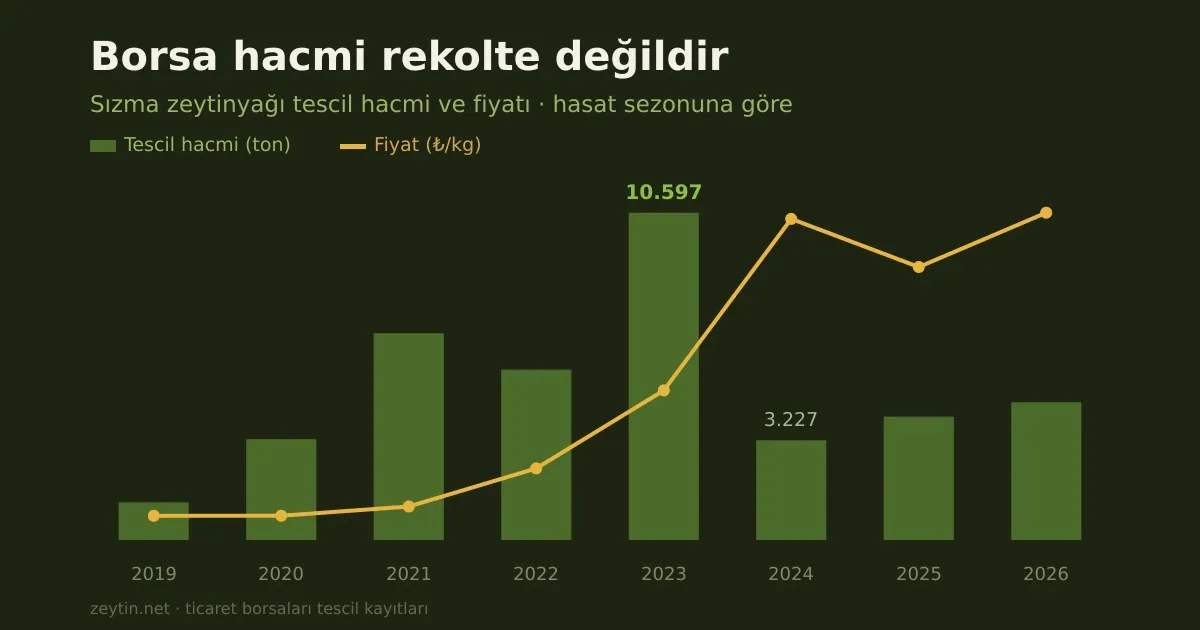
10,597 tonnes registered in 2023, down to 3,227 the next season. Harvest collapse or a change of channel? The data cannot tell them apart.
Whenever olive oil prices come up, the sentence starts in the same place: the harvest fell, so the price rose. It fits intuition and it is often true. But verifying it in Türkiye is harder than it looks, because we do not have harvest data — what we have is the quantity registered as sold on commodity exchanges, and the two are not the same thing.
This article is about that difference. Take it seriously, and part of the familiar story stops standing up.
What the data is, and what it is not
Every sale made on a commodity exchange has its quantity and price entered into the record. We collect extra virgin olive oil registrations from the Aydın, Edremit, Nazilli, Gaziantep and Bandırma exchanges from 2019 to today: 1,257 records, roughly 39,000 tonnes.
This measures the volume of oil changing hands through the exchanges.
It does not measure the volume of oil produced in Türkiye.
The difference is large. A grower can sell directly to a brand, deliver to a cooperative, bottle and sell their own oil, or simply hold it and not sell at all. None of that enters the exchange record. Registered volume is therefore a measure not of production but of the share of trade that passes through the exchange.
Once you accept that distinction, the way you read the movements in the table changes.
Season by season
In olive oil the calendar year is misleading; the harvest begins in November and the crop spreads into the following year. The table below is therefore organised by harvest season: November through October.
| Season | Registered volume (t) | Average price (TL/kg) | Volume change | Price change |
|---|---|---|---|---|
| 2019 | 1,219 | 18.45 | — | — |
| 2020 | 3,264 | 18.55 | +168% | +1% |
| 2021 | 6,695 | 25.51 | +105% | +38% |
| 2022 | 5,516 | 54.58 | −18% | +114% |
| 2023 | 10,597 | 113.98 | +92% | +109% |
| 2024 | 3,227 | 244.70 | −70% | +115% |
| 2025 | 3,994 | 208.06 | +24% | −15% |
| 2026 | 4,460 | 249.43 | +12% | +20% |
A season runs from November to the following October; the 2026 season is not yet complete. Fewer exchanges reported in the early years, which pulls those volumes down.
Does lower volume mean higher prices?
It is tempting to look at the two columns and conclude exactly that. In 2024 volume fell 70% and the price rose 115% — a textbook supply-and-price relationship.
But the whole series breaks the pattern. In 2021 volume rose 105% and the price rose 38%. In 2023 volume rose 92% and the price rose 109%. The largest volume and the sharpest price rise fall in the same season.
Across the seven change-pairs in eight seasons the correlation coefficient works out at −0.47. The direction is the expected one: more volume, lower prices. But with seven observations that coefficient carries no statistical weight; chance alone produces values like it easily enough.
The honest answer is that our data shows no reliable relationship between volume and price. That does not mean none exists. It means what we are measuring is trade volume, not supply.
2023: plenty of oil and high prices at once
The most striking season in the series is 2023. Exchanges registered 10,597 tonnes — half as much again as the second-highest season. In the same season the price went from 54 to 114 lira.
Abundant supply lifting prices looks like a contradiction. The explanation lies not in supply but in demand and the speed of trade.
2023 was a period when production fell across the Mediterranean and Spain was struggling with drought. Turkish oil found strong buyers at home and abroad. As prices rose, more sellers came forward, buyers were easy to find, and trade accelerated. The exchange record measured exactly that: not more production, but more changing of hands.
The 2023 record is a liquidity record, not a harvest record.
2024: volume down to a third
The following season volume fell from 10,597 to 3,227 tonnes — the sharpest drop in the series.
There are three plausible explanations, and our data cannot say which dominates:
The harvest may have fallen. Olive trees show "alternate bearing": a heavy year is typically followed by a light one.
Trade may have moved off-exchange. When prices rise quickly, direct sales become attractive. In a period when export restrictions were under discussion, a shift towards channels outside the exchange is unsurprising.
Holding may have increased. A grower who expects prices to rise does not sell. That lowers volume while pushing prices up.
All three may have happened at once. Choosing one on the strength of this data would be forcing it.
Aydın and Edremit: two exchanges, two stories
Almost all registrations come from two exchanges, Aydın and Edremit, and the balance between them is not stable.
| Year | Aydın | Edremit | Aydın share |
|---|---|---|---|
| 2019 | 852 | 777 | 52% |
| 2021 | 3,642 | 3,419 | 52% |
| 2023 | 6,948 | 3,397 | 67% |
| 2024 | 2,092 | 1,089 | 66% |
| 2026 | 2,513 | 854 | 65% |
Between 2019 and 2021 the two exchanges were near parity; from 2023 Aydın's share rises to two thirds. Edremit's volume falls in absolute terms too: 3,419 tonnes in 2021, 854 tonnes over the first eight months of 2026.
This does not mean less olive oil is being made around Edremit. The likelier explanation is that the bay's output is moving into the branded and bottled channel, which does not pass through an exchange. The Ayvalık-Edremit line is where boutique olive oil is most concentrated in Türkiye, and that is consistent with falling exchange volume.
Nazilli entering the table with 511 tonnes in 2026 shows the reporting base widening as well. Structural changes like these have to be allowed for when reading the series.
Alternate bearing
Olive trees have a rhythm of their own, and it affects every calculation in the sector.
After a heavy year, a tree yields noticeably less the next. Fruit formation consumes most of the tree's energy, leaving the following year's flower buds weak. In agronomy this is called alternate bearing.
Good management softens it but cannot remove it. Pruning, feeding and above all early harvesting — not working the tree all the way to full ripeness — protect the following year's yield.
The consequence for the sector is that olive oil has to be read two years at a time. Looking at a single season and declaring a collapse or a record presents the tree's normal behaviour as an extraordinary event. The 2023-2024 pair in our table should largely be read within that rhythm.
How other countries measure this
In the European Union price data is collected from representative market prices reported by member states and published weekly by the Commission. Quantities come from a separate system of mandatory stock declarations: in Spain the volume of olive oil in storage is reported and published every month.
That pairing lets price and stock be read together. Türkiye has no publicly published equivalent, which leaves exchange volume as the closest indicator available to us.
It is a gap, but not an unbridgeable one. Regular public stock data would put the sector's price expectations on far firmer ground than they stand on today.
What this data can and cannot do
It can track prices. The price side is solid: every record is a real transaction, and the volume-weighted average represents the market well.
It can track liquidity. Sudden falls in registered volume are an early sign that something has changed, even when the cause is unclear.
It cannot estimate the harvest. Exchange volume is not production, and the gap between them varies from year to year.
It cannot support conclusions about exports. An exchange record does not show where the product went.
We spell out these limits for a reason: the same data could carry the headline "Turkish olive oil production fell by two thirds", and that headline would be wrong. Part of the responsibility of publishing data is saying what it does not say.
Summary
- Registered exchange volume is not production; it is the share of trade passing through the exchanges.
- The 2023 season was a liquidity record, not a harvest record: 10,597 tonnes.
- Whether the 70% drop in 2024 came from the harvest or from a change of channel, the data does not say.
- The volume-price correlation (−0.47) points the expected way but means nothing with seven observations.
- Edremit's share is falling, most likely because its output is moving into the branded channel rather than shrinking.
Current figures and charts are on our market page; the raw data can be downloaded as CSV.
Related reading: From olive to oil: the price gap · Is Turkish olive oil cheap? · Weekly bulletin
One rating per visitor; you can change yours at any time. Ratings are real reader votes — no seeded or default scores.
Related
 Article
Vegetation water and pomace: olive oil's waste problem
Processing 1.5–2 million tonnes of olives yields 1 million tonnes of vegetation water and 1 million tonnes of pomace. Waste, or resource?
Article
Vegetation water and pomace: olive oil's waste problem
Processing 1.5–2 million tonnes of olives yields 1 million tonnes of vegetation water and 1 million tonnes of pomace. Waste, or resource?
 Article
How war destroys an olive grove: denial of access does more than the bomb
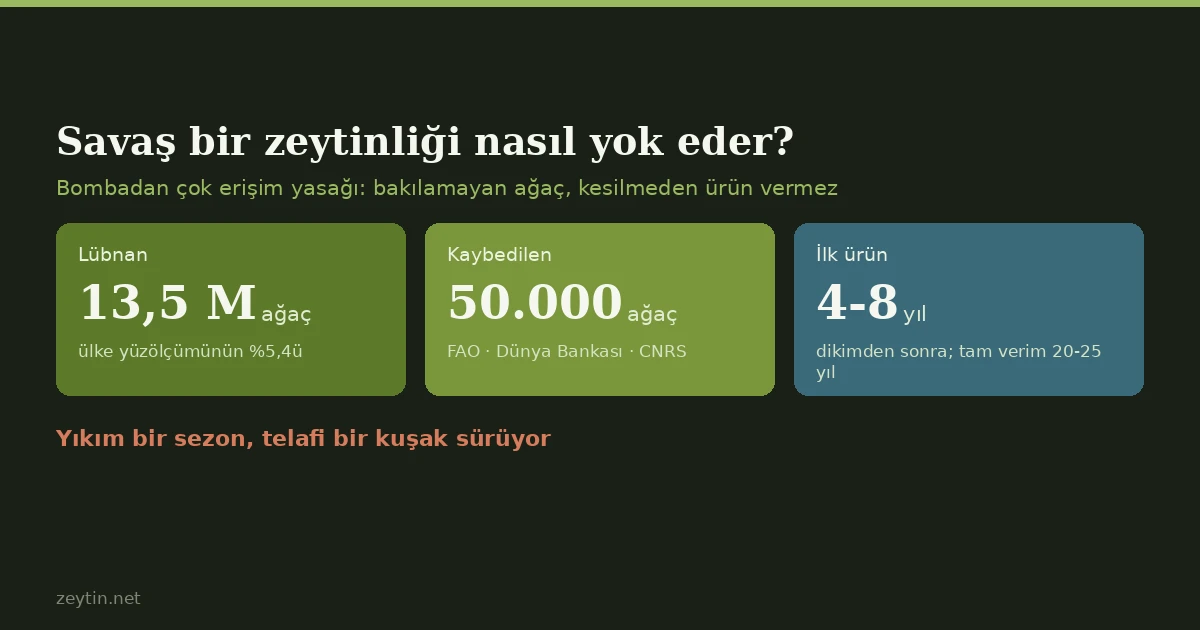
An olive grove is not an annual field: first fruit takes 4-8 years, full yield 20-25. War's damage is therefore generational, not seasonal. We read the picture in Lebanon and Palestine through the tree's own biology.
Article
How war destroys an olive grove: denial of access does more than the bomb
An olive grove is not an annual field: first fruit takes 4-8 years, full yield 20-25. War's damage is therefore generational, not seasonal. We read the picture in Lebanon and Palestine through the tree's own biology.
 Article
Two thirds of our exports are table olives: the $260 million picture
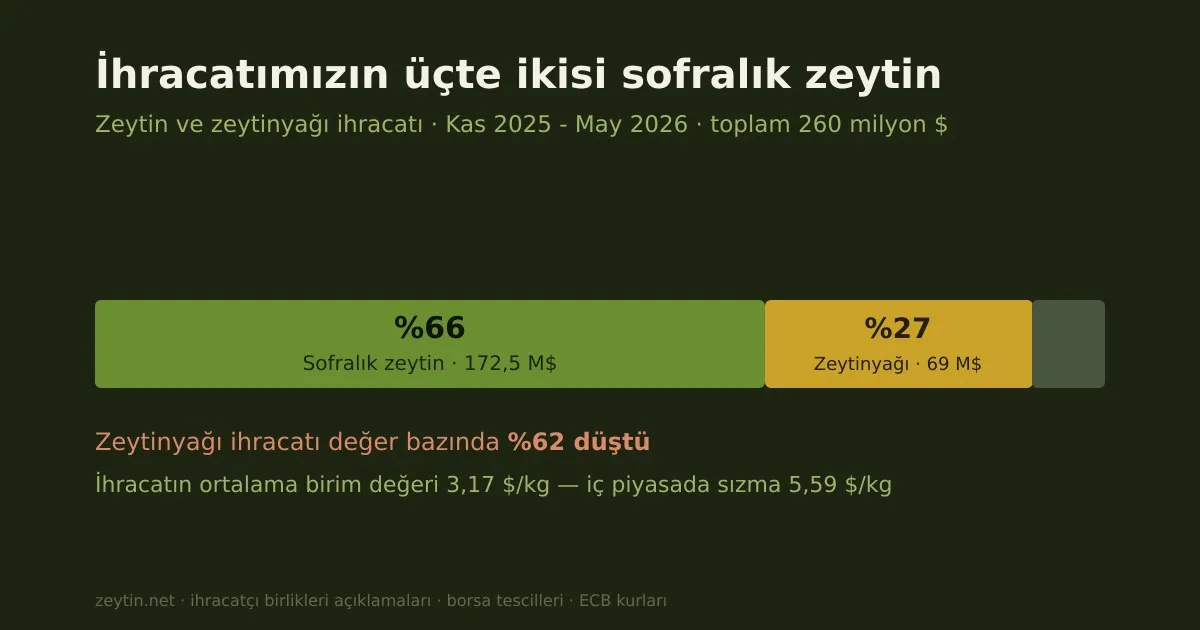
In 2025-26, 66% of exports were table olives and 27% oil. Average unit value $3.17/kg — the added value sits inside the packaging.
Article
Two thirds of our exports are table olives: the $260 million picture
In 2025-26, 66% of exports were table olives and 27% oil. Average unit value $3.17/kg — the added value sits inside the packaging.
 Article
Rain in Andalusia, prices in Aydın: how Spain's drought set the price in Türkiye
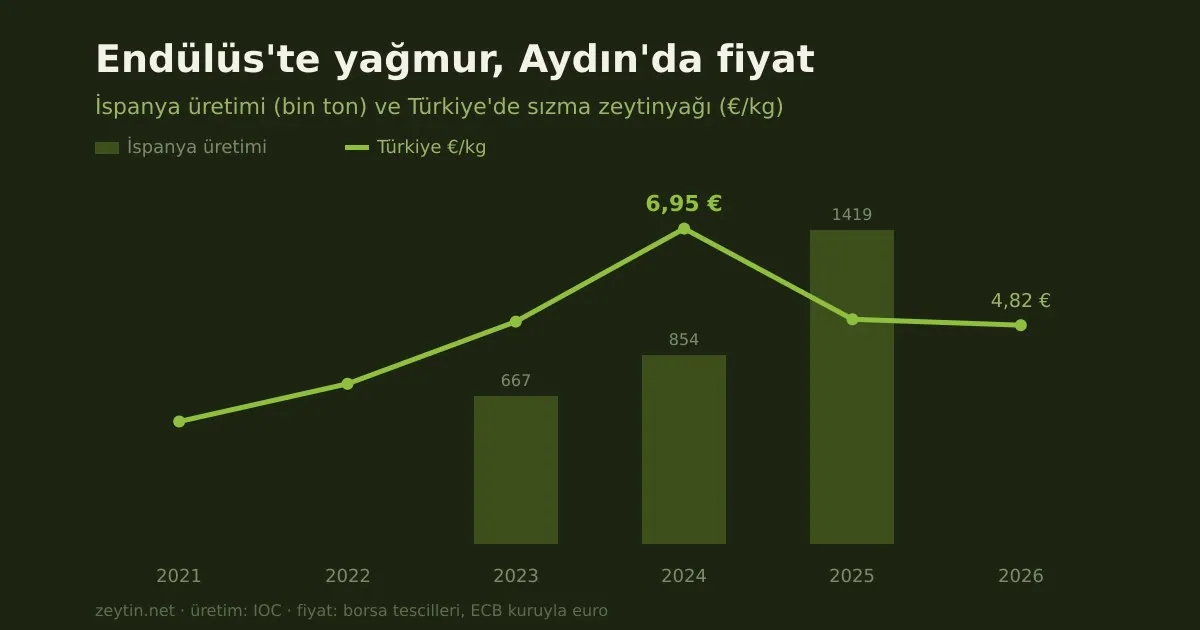
Spain makes 40% of the world's olive oil. Its output halved in 2022/23 and Türkiye's euro price went from €2.70 to €6.95.
Article
Rain in Andalusia, prices in Aydın: how Spain's drought set the price in Türkiye
Spain makes 40% of the world's olive oil. Its output halved in 2022/23 and Türkiye's euro price went from €2.70 to €6.95.